Algebra and Trigonometry (6th Edition)
6th Edition
ISBN: 9780134463216
Author: Robert F. Blitzer
Publisher: PEARSON
expand_more
expand_more
format_list_bulleted
Concept explainers
Topic Video
Question
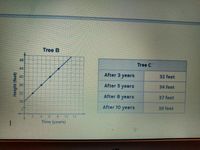
Researchers are comparing the growth rates of trees in a forest. The height of tree B over time is shown in the graph. The height of a new tree, C is shown in the table.
1. How many feet did tree B grow per year?
2. How many feet did tree C grow per year?
3. Which tree grew faster?
*Please answer 1-3. I only have limited questions and can't post all of this individually. Thank you!*
*FOR AN EXPERIMENT!!

Transcribed Image Text:Tree B
48
Tree C
44
After 3 years
32 feet
40
36
After 5 years
34 feet
32
After 8 years
37 feet
28
After 10 yearS
39 feet
21
10-12
Time (years)
Height (feet)
Expert Solution
This question has been solved!
Explore an expertly crafted, step-by-step solution for a thorough understanding of key concepts.
This is a popular solution
Trending nowThis is a popular solution!
Step by stepSolved in 2 steps with 2 images

Knowledge Booster
Learn more about
Need a deep-dive on the concept behind this application? Look no further. Learn more about this topic, algebra and related others by exploring similar questions and additional content below.Similar questions
- Which color are you more likely to pick? Put red cubes and yellow cubes in a bag. Reach in and pick one cube. Color the graph to show what you picked. Put the cube back in the bag. Pick 10 times in all. Write your results. Put 20 red cubes and 10 yellow cubes in a bag. 3 Put 20 red cubes and 2 yellow cubes in a bag. Don't peek! Put 10 red cubes and 10 yellow cubes in a bag. Share Compare your results with your classmates. How are they alike? How are they different? red yellow red yellow red yellow COOarrow_forwardPlease do not give solution in image format thanku You want to host a giveaway on Facebook to promote your new side hustle. You are giving away a $50 gift card for your business. Anyone who likes/follows your Facebook page is entered into the drawing. According to a recent study, you predict your side hustle will earn, on average, $.50 per like/follow. Your giveaway deadline passes, and you have 189 new followers on your Facebook page since the giveaway was first promoted. Using expected value, answer the following: Was this a successful giveaway (in terms of expected value)? How many followers would have made this giveaway a “fair game”? What would the expected value have been if you only gained 94 new followers?arrow_forwardUse the graph shown to answer the next 7 questions. 10, .. 10 10 10arrow_forward
- The following line graph shows the price of a stock over the previous two weeks. Use the graph to determine the number of days in which the price was between $50$50 and $60$60. Value of Stock for Two WeeksDay1234567891011121314Price (in Dollars)40506070arrow_forwardfx) = 1,000+25x, where * represents of how many months did the value of the savings bond first begin to exceed the value of the savings account? A. 27 months B. 28 months C. 32 months D. 33 months Part 3: Lesson 4.3 (Graphing Exponential Functions) Standards: F.IF.6, F.IF.7 9. Which point lies on the graph of (1.2-) A. 1. 2 B. C. C2, 18) D. C3, 2) 10. Which is the graph of y = -2(2)*? 8+arrow_forwardHow do you make a stem and leaf graph with numbers such as these 0.06, 0.07,0.09,... 0.35 including a key. Thank youarrow_forward
- The following double-line graph compares the number of actual home sales to the number of homes for sale from 2000 - 2008. Study the graph and answer the questions that follow. Number of units (In thousands) 8000F Home Sates 7000- Homes for Sale 6000+ 5000+ 4000+ 3000+ 2000- 1000+ 2000 2002 2004 2006 2008 Year ✔ *** a. In what year did the biggest drop in home sales occur? By approximately how many units did sales drop? A. 2007; approximately 1,200,000 O B. 2007; approximately 4,800,000 O C. 2008; approximately 4,800,000 O D. 2008; approximately 1,200,000 b. Identify at least two years when the number of sales and the number of homes for sale both increased. O A. 2001, 2002 OB. 2002, 2005 OC. 2002, 2008 OD. 2001, 2003 c. In what year were home sales at their lowest level? In what year were home sales at their highest level? O A. lowest: 2002; highest: 2006 O B. lowest: 2002; highest: 2008 O C. lowest: 2001; highest: 2006 O D. lowest: 2001; highest: 2007 d. Based on your answer to part…arrow_forward2. Determine if the following graphs represent a linear, quadratic, or exponential relationship. -20 20arrow_forwardUse the graph shown to answer the next 7 questions. 10, .. 10 10 10arrow_forward
arrow_back_ios
SEE MORE QUESTIONS
arrow_forward_ios
Recommended textbooks for you
 Algebra and Trigonometry (6th Edition)AlgebraISBN:9780134463216Author:Robert F. BlitzerPublisher:PEARSON
 Contemporary Abstract AlgebraAlgebraISBN:9781305657960Author:Joseph GallianPublisher:Cengage Learning
 Linear Algebra: A Modern IntroductionAlgebraISBN:9781285463247Author:David PoolePublisher:Cengage Learning
 Algebra And Trigonometry (11th Edition)AlgebraISBN:9780135163078Author:Michael SullivanPublisher:PEARSON
 Introduction to Linear Algebra, Fifth EditionAlgebraISBN:9780980232776Author:Gilbert StrangPublisher:Wellesley-Cambridge Press
 College Algebra (Collegiate Math)AlgebraISBN:9780077836344Author:Julie Miller, Donna GerkenPublisher:McGraw-Hill Education

Algebra and Trigonometry (6th Edition)
Algebra
ISBN:9780134463216
Author:Robert F. Blitzer
Publisher:PEARSON

Contemporary Abstract Algebra
Algebra
ISBN:9781305657960
Author:Joseph Gallian
Publisher:Cengage Learning

Linear Algebra: A Modern Introduction
Algebra
ISBN:9781285463247
Author:David Poole
Publisher:Cengage Learning

Algebra And Trigonometry (11th Edition)
Algebra
ISBN:9780135163078
Author:Michael Sullivan
Publisher:PEARSON

Introduction to Linear Algebra, Fifth Edition
Algebra
ISBN:9780980232776
Author:Gilbert Strang
Publisher:Wellesley-Cambridge Press

College Algebra (Collegiate Math)
Algebra
ISBN:9780077836344
Author:Julie Miller, Donna Gerken
Publisher:McGraw-Hill Education