MATLAB: An Introduction with Applications
6th Edition
ISBN: 9781119256830
Author: Amos Gilat
Publisher: John Wiley & Sons Inc
expand_more
expand_more
format_list_bulleted
Question
thumb_up100%
can you go through the steps in detail, please?
I want to understand the logic

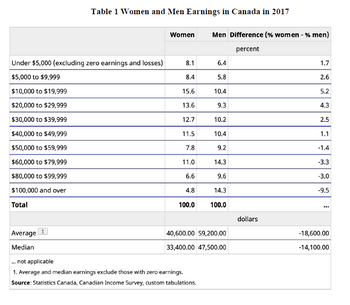
Transcribed Image Text:Table 1 Women and Men Earnings in Canada in 2017
Under $5,000 (excluding zero earnings and losses)
$5,000 to $9,999
$10,000 to $19,999
$20,000 to $29,999
$30,000 to $39,999
$40,000 to $49,999
$50,000 to $59,999
$60,000 to $79,999
$80,000 to $99,999
$100,000 and over
Total
Average
Median
Women Men Difference (% women - % men)
percent
8.1
8.4
15.6
13.6
12.7
11.5
7.8
11.0
6.6
4.8
100.0
6.4
5.8
10.4
9.3
10.2
... not applicable
1. Average and median earnings exclude those with zero earnings.
Source: Statistics Canada, Canadian Income Survey, custom tabulations.
10.4
9.2
14.3
9.6
14.3
100.0
40,600.00 59,200.00
33,400.00 47,500.00
dollars
1.7
2.6
5.2
4.3
2.5
1.1
-1.4
-3.3
-3.0
-9.5
-18,600.00
-14,100.00

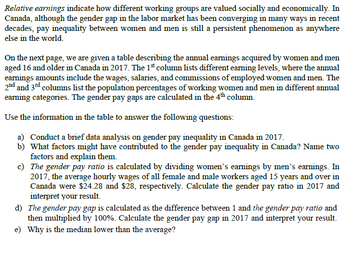
Transcribed Image Text:Relative earnings indicate how different working groups are valued socially and economically. In
Canada, although the gender gap in the labor market has been converging in many ways in recent
decades, pay inequality between women and men is still a persistent phenomenon as anywhere
else in the world.
On the next page, we are given a table describing the annual earnings acquired by women and men
aged 16 and older in Canada in 2017. The 1st column lists different earning levels, where the annual
earnings amounts include the wages, salaries, and commissions of employed women and men. The
2nd and 3rd columns list the population percentages of working women and men in different annual
earning categories. The gender pay gaps are calculated in the 4th column.
Use the information in the table to answer the following questions:
a) Conduct a brief data analysis on gender pay inequality in Canada in 2017.
b) What factors might have contributed to the gender pay inequality in Canada? Name two
factors and explain them.
c)
The gender pay ratio is calculated by dividing women's earnings by men's earnings. In
2017, the average hourly wages of all female and male workers aged 15 years and over in
Canada were $24.28 and $28, respectively. Calculate the gender pay ratio in 2017 and
interpret your result.
d) The gender pay gap is calculated as the difference between 1 and the gender pay ratio and
then multiplied by 100%. Calculate the gender pay gap in 2017 and interpret your result.
e) Why is the median lower than the average?
Expert Solution
This question has been solved!
Explore an expertly crafted, step-by-step solution for a thorough understanding of key concepts.
Step 1: Write the given information
VIEW Step 2: Conduct a brief data analysis on gender pay inequality in Canada in 2017
VIEW Step 3: What factors might have contributed to the gender pay inequality in Canada
VIEW Step 4: Calculate the gender pay ratio and the gender pay gap in 2017 and interpret the results
VIEW Solution
VIEW Step by stepSolved in 5 steps with 3 images

Knowledge Booster
Similar questions
- Can you please help me for this exercise and write the steps for me and circle the answer so that I can understand. That I can solve other exercises like this one.arrow_forwardHow do I find the set of equations?arrow_forwardI'm getting that the B is incorrect. Thank you for writing this out so I can go over and practice.arrow_forward
arrow_back_ios
arrow_forward_ios
Recommended textbooks for you
 MATLAB: An Introduction with ApplicationsStatisticsISBN:9781119256830Author:Amos GilatPublisher:John Wiley & Sons Inc
 Probability and Statistics for Engineering and th...StatisticsISBN:9781305251809Author:Jay L. DevorePublisher:Cengage Learning
 Statistics for The Behavioral Sciences (MindTap C...StatisticsISBN:9781305504912Author:Frederick J Gravetter, Larry B. WallnauPublisher:Cengage Learning
 Elementary Statistics: Picturing the World (7th E...StatisticsISBN:9780134683416Author:Ron Larson, Betsy FarberPublisher:PEARSON
 The Basic Practice of StatisticsStatisticsISBN:9781319042578Author:David S. Moore, William I. Notz, Michael A. FlignerPublisher:W. H. Freeman
 Introduction to the Practice of StatisticsStatisticsISBN:9781319013387Author:David S. Moore, George P. McCabe, Bruce A. CraigPublisher:W. H. Freeman

MATLAB: An Introduction with Applications
Statistics
ISBN:9781119256830
Author:Amos Gilat
Publisher:John Wiley & Sons Inc

Probability and Statistics for Engineering and th...
Statistics
ISBN:9781305251809
Author:Jay L. Devore
Publisher:Cengage Learning

Statistics for The Behavioral Sciences (MindTap C...
Statistics
ISBN:9781305504912
Author:Frederick J Gravetter, Larry B. Wallnau
Publisher:Cengage Learning

Elementary Statistics: Picturing the World (7th E...
Statistics
ISBN:9780134683416
Author:Ron Larson, Betsy Farber
Publisher:PEARSON

The Basic Practice of Statistics
Statistics
ISBN:9781319042578
Author:David S. Moore, William I. Notz, Michael A. Fligner
Publisher:W. H. Freeman

Introduction to the Practice of Statistics
Statistics
ISBN:9781319013387
Author:David S. Moore, George P. McCabe, Bruce A. Craig
Publisher:W. H. Freeman