
MATLAB: An Introduction with Applications
6th Edition
ISBN: 9781119256830
Author: Amos Gilat
Publisher: John Wiley & Sons Inc
expand_more
expand_more
format_list_bulleted
Related questions
Question
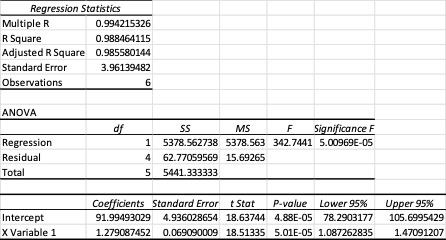
The following table is the partial reproduction of Regression routine output in Microsoft Excel
relating the total cost of production TC to the level of output Q.
Use the information in the table and answer the following:
- a) Report the estimated equation.
- b) Evaluate the regression model

Transcribed Image Text:Regression Statistics
Multiple R
R Square
Adjusted R Square
Standard Error
Observations
ANOVA
Regression
Residual
Total
Intercept
X Variable 1
0.994215326
0.988464115
0.985580144
3.96139482
df
6
SS
MS
F
Significance F
1 5378.562738 5378.563 342.7441 5.00969E-05
4 62.77059569 15.69265
5 5441.333333
Coefficients Standard Error t Stat P-value Lower 95%
91.99493029 4.936028654 18.63744 4.88E-05 78.2903177
1.279087452 0.069090009 18.51335 5.01E-05 1.087262835
Upper 95%
105.6995429
1.47091207
Expert Solution
This question has been solved!
Explore an expertly crafted, step-by-step solution for a thorough understanding of key concepts.

Step by stepSolved in 4 steps with 4 images

Knowledge Booster

Similar questions
- Calculate two lines of regression and calculate a linear regression equation to model the data given below: years (1980,1985,1990,1995,2000) Enrolment ( 21,25,29,39,47)arrow_forwardYummy Lunch Restaurant needs to decide the most profitable location for their business expansion. Marketing manager plans to use a multiple regression model to achieve their target. His model considers yearly revenue as the dependent variable. He found that number of people within 2KM (People), Mean household income(income), no of competitors and price as explanatory variables of company yearly revenue. The following is the descriptive statistics and regression output from Excel. Revenue People Income Competitors Price Mean 343965.68 5970.26 41522.96 2.8 5.68 Standard Error 5307.89863 139.0845281 582.1376385 0.142857 0.051030203 Median 345166.5 6032 41339.5 3 5.75 Mode #N/A 5917 #N/A 3 6 Standard Deviation 37532.51115 983.47613 4116.334718 1.010153 0.360838027 Sample Variance 1408689393 967225.2984 16944211.51 1.020408 0.130204082 Sum 17198284 298513 2076148…arrow_forwardThis was not the correct quadratic model for the dataarrow_forward
arrow_back_ios
arrow_forward_ios
Recommended textbooks for you
- MATLAB: An Introduction with ApplicationsStatisticsISBN:9781119256830Author:Amos GilatPublisher:John Wiley & Sons Inc
 Probability and Statistics for Engineering and th...StatisticsISBN:9781305251809Author:Jay L. DevorePublisher:Cengage Learning
 Statistics for The Behavioral Sciences (MindTap C...StatisticsISBN:9781305504912Author:Frederick J Gravetter, Larry B. WallnauPublisher:Cengage Learning
  Elementary Statistics: Picturing the World (7th E...StatisticsISBN:9780134683416Author:Ron Larson, Betsy FarberPublisher:PEARSON
 The Basic Practice of StatisticsStatisticsISBN:9781319042578Author:David S. Moore, William I. Notz, Michael A. FlignerPublisher:W. H. Freeman
 Introduction to the Practice of StatisticsStatisticsISBN:9781319013387Author:David S. Moore, George P. McCabe, Bruce A. CraigPublisher:W. H. Freeman
MATLAB: An Introduction with Applications
Statistics
ISBN:9781119256830
Author:Amos Gilat
Publisher:John Wiley & Sons Inc
Probability and Statistics for Engineering and th...
Statistics
ISBN:9781305251809
Author:Jay L. Devore
Publisher:Cengage Learning
Statistics for The Behavioral Sciences (MindTap C...
Statistics
ISBN:9781305504912
Author:Frederick J Gravetter, Larry B. Wallnau
Publisher:Cengage Learning
Elementary Statistics: Picturing the World (7th E...
Statistics
ISBN:9780134683416
Author:Ron Larson, Betsy Farber
Publisher:PEARSON
The Basic Practice of Statistics
Statistics
ISBN:9781319042578
Author:David S. Moore, William I. Notz, Michael A. Fligner
Publisher:W. H. Freeman
Introduction to the Practice of Statistics
Statistics
ISBN:9781319013387
Author:David S. Moore, George P. McCabe, Bruce A. Craig
Publisher:W. H. Freeman