
MATLAB: An Introduction with Applications
6th Edition
ISBN: 9781119256830
Author: Amos Gilat
Publisher: John Wiley & Sons Inc
expand_more
expand_more
format_list_bulleted
Related questions
Concept explainers
Question
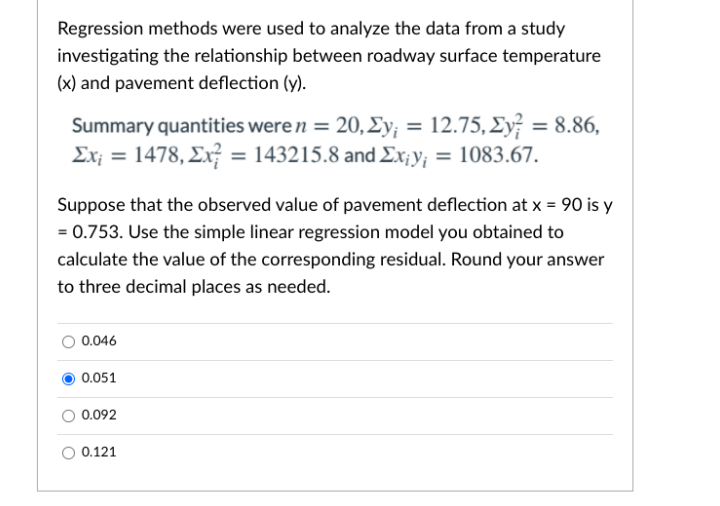

Transcribed Image Text:Regression methods were used to analyze the data from a study
investigating the relationship between roadway surface temperature
(x) and pavement deflection (y).
Summary quantities were n = 20, Ey; = 12.75, Ey = 8.86,
Σχ1478 , Σ;143215.8 and Σx:y- 1083.67.
Suppose that the observed value of pavement deflection at x = 90 is y
= 0.753. Use the simple linear regression model you obtained to
calculate the value of the corresponding residual. Round your answer
to three decimal places as needed.
0.046
0.051
0.092
0.121
Expert Solution
This question has been solved!
Explore an expertly crafted, step-by-step solution for a thorough understanding of key concepts.

This is a popular solution

Trending nowThis is a popular solution!

Step by stepSolved in 2 steps with 1 images

Knowledge Booster


Learn more about
Need a deep-dive on the concept behind this application? Look no further. Learn more about this topic, statistics and related others by exploring similar questions and additional content below.Similar questions
- A regression analysis was performed to determine if there is a relationship between hours ofTV watched per day r) and number of sit ups a person can do (y). The results of the regression were: у-ах+b a=-0.827 b=35.329 r2=0.540225 r=-0.735 Use this to predict the number of sit ups a person who watches 13.5 hours of TV can do, and please round your answer to a whole number.arrow_forwardc) Show that the coefficient of determination, R², can also be obtained as the squared correlation between actual Y values and the Y values estimated from the regression model where Y is the dependent variable. Note that the coefficient of correlation between Y and X is Eyixi r = And also that ỹ = ŷ (18.75)arrow_forwardA regression was run to determine if there is a relationship between hours of study per week (x) and the final exam scores (y).The results of the regression were: y=ax+b a=5.088 b=26.56 r2=0.913936 r=0.956 Use this to predict the final exam score of a student who studies 4.5 hours per week, and please round your answer to a whole number.arrow_forward
- A regression was run to determine if there is a relationship between hours of study per week (x) and the final exam scores (y). The results of the regression were: y=ax+b a=6.239 b=38.43 r²=0.758641 r=0.871 Use this to predict the final exam score of a student who studies 6 hours per week, and please round your answer to a whole number.arrow_forwardA regression was run to determine if there is a relationship between hours of study per week (x) and the final exam scores (y). The results of the regression were: y=ax+b a=5.865 b=25.06 r²=0.81 r=0.9 Use this to predict the final exam score of a student who studies 4.5 hours per week, and please round your answer to a whole number.arrow_forwardA regression was run to determine if there is a relationship between hours of study per week (x) and the final exam Scores (y). The results of the regression were: y=ax+b a=6.179 b=28.96 r²=0.937024 r=0.968 Use this to predict the final exam score of a student who studies 4 hours per week, and please round your answer to a whole number.arrow_forward
- The variation of Y around its mean can be decomposed into which two parts?arrow_forwardIn calculating a simple regression for average number of drinks consumed (x) and grade point average (y), you get a slope coefficient (b) of -.15 and a y intercept of 2.50. Using the formula Y = a + bX, what would the predicted grade point average be for a student who averaged 1.0 drinks per week?arrow_forwardA regression was run to determine if there is a relationship between hours of study per week (xx) and the final exam scores (yy).The results of the regression were: y=ax+b a=5.614 b=32.79 r2=0.808201 r=0.899 Use this to predict the final exam score of a student who studies 1 hours per week, and please round your answer to a whole number.arrow_forward
arrow_back_ios
arrow_forward_ios
Recommended textbooks for you
- MATLAB: An Introduction with ApplicationsStatisticsISBN:9781119256830Author:Amos GilatPublisher:John Wiley & Sons Inc
 Probability and Statistics for Engineering and th...StatisticsISBN:9781305251809Author:Jay L. DevorePublisher:Cengage Learning
 Statistics for The Behavioral Sciences (MindTap C...StatisticsISBN:9781305504912Author:Frederick J Gravetter, Larry B. WallnauPublisher:Cengage Learning
  Elementary Statistics: Picturing the World (7th E...StatisticsISBN:9780134683416Author:Ron Larson, Betsy FarberPublisher:PEARSON
 The Basic Practice of StatisticsStatisticsISBN:9781319042578Author:David S. Moore, William I. Notz, Michael A. FlignerPublisher:W. H. Freeman
 Introduction to the Practice of StatisticsStatisticsISBN:9781319013387Author:David S. Moore, George P. McCabe, Bruce A. CraigPublisher:W. H. Freeman
MATLAB: An Introduction with Applications
Statistics
ISBN:9781119256830
Author:Amos Gilat
Publisher:John Wiley & Sons Inc
Probability and Statistics for Engineering and th...
Statistics
ISBN:9781305251809
Author:Jay L. Devore
Publisher:Cengage Learning
Statistics for The Behavioral Sciences (MindTap C...
Statistics
ISBN:9781305504912
Author:Frederick J Gravetter, Larry B. Wallnau
Publisher:Cengage Learning
Elementary Statistics: Picturing the World (7th E...
Statistics
ISBN:9780134683416
Author:Ron Larson, Betsy Farber
Publisher:PEARSON
The Basic Practice of Statistics
Statistics
ISBN:9781319042578
Author:David S. Moore, William I. Notz, Michael A. Fligner
Publisher:W. H. Freeman
Introduction to the Practice of Statistics
Statistics
ISBN:9781319013387
Author:David S. Moore, George P. McCabe, Bruce A. Craig
Publisher:W. H. Freeman