
MATLAB: An Introduction with Applications
6th Edition
ISBN: 9781119256830
Author: Amos Gilat
Publisher: John Wiley & Sons Inc
expand_more
expand_more
format_list_bulleted
Related questions
Question
Data set(Passing rate) google sheets for better view: https://docs.google.com/spreadsheets/d/1kxNXFbEldq4qMcOM-vA3BnZBkLNvmTt8/edit?usp=sharing&ouid=108123451971094818038&rtpof=true&sd=true
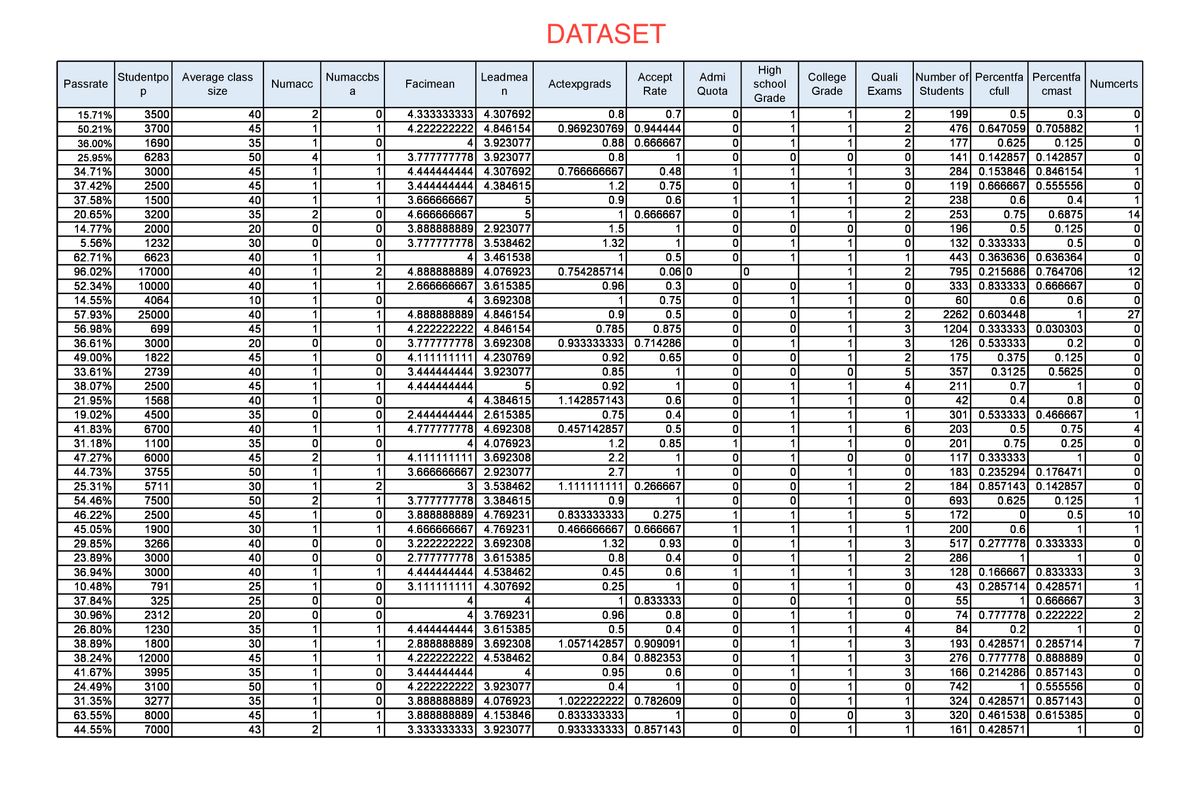

Transcribed Image Text:DATASET
High
Studentpo Average class
Numaccbs
Leadmea
Ассept
Rate
Admi
Quali
Number of Percentfa Percentfa
College
Passrate
Numacc
Facimean
Actexpgrads
school
Numcerts
size
a
Quota
Grade
Exams
Students
cfull
cmast
Grade
4.333333333 4.307692
4.222222222 4.846154
4 3.923077
3.777777778 3.923077
4.444444444 4.307692
3.444444444 4.384615
15.71%
3500
40
2
0.8
0.7
1
1
2
199
0.5
0.3
476 0.647059 0.705882
0.125
141 0.142857 0.142857
284 0.153846 0.846154
119 0.666667 0.555556
0.969230769 0.944444
0.88 0.666667
50.21%
3700
45
1
1
1
1
2
1
36.00%
1690
35
1
1
1
2
177
0.625
25.95%
6283
50
4
1
0.8
1
34.71%
3000
45
1
1
0.766666667
0.48
1
1
1
3
1
37.42%
2500
45
1
1
1.2
0.75
1
1
37.58%
1500
40
1
1
3.666666667
5
0.9
0.6
1
1
1
2
238
0.6
0.4
1
20.65%
3200
35
2
4.666666667
1 0.666667
1
1
2
253
0.75
0.6875
14
3.888888889 2.923077
3.777777778 3.538462
4 3.461538
4.888888889 4.076923
2.666666667 3.615385
4 3.692308
4.888888889 4.846154
4.222222222 4.846154
3.777777778 3.692308
4.111111111 4.230769
3.444444444 3.923077
4.444444444
14.77%
2000
20
1.5
1
0.
196
0.5
0.125
1.32
132 0.333333
443 0.363636 0.636364
795 0.215686 0.764706
333 0.833333 0.666667
5.56%
1232
30
1
1
1
0.5
62.71%
6623
40
1
1
1
0.5
1
1
1
96.02%
17000
40
1
2
0.754285714
0.06 0
1
2
12
52.34%
10000
40
1
1
0.96
0.3
1
14.55%
4064
10
1
1
0.75
1
1
60
0.6
0.6
57.93%
27
2262 0.603448
1204 0.333333 0.030303
126 0.533333
25000
40
1
1
0.9
0.5
1
2
1
0.785
0.933333333 0.714286
0.92
56.98%
699
45
1
1
0.875
1
36.61%
3000
20
1
1
3
0.2
0.125
0.5625
49.00%
1822
45
1
0.65
1
2
175
0.375
33.61%
2739
40
1
0.85
1
5
357
0.3125
0.92
1.142857143
38.07%
2500
45
1
1
5
1
1
1
4
211
0.7
1
21.95%
4 4.384615
2.444444444 2.615385
4.777777778 4.692308
4 4.076923
4.111111111 3.692308
3.666666667 2.923077
3 3.538462
3.777777778 3.384615
3.888888889 4.769231
4.666666667| 4.769231
3.222222222 3.692308
2.777777778 3.615385
4.444444444| 4.538462
3.111111111 4.307692
1568
40
1
0.6
1
1
42
0.4
0.8
301 0.533333 0.466667
0.75
19.02%
4500
35
0.
0.75
0.4
1
1
1
1
41.83%
6700
40
1
1
0.457142857
0.5
1
1
6.
203
0.5
4
31.18%
1100
35
1.2
0.85
1
1
1
201
0.75
0.25
117 0.333333
183 0.235294 0.176471
184 0.857143 0.142857
0.625
47.27%
6000
45
2
1
2.2
1
1
1
2.7
1.111111111 0.266667
44.73%
3755
50
1
1
1
1
25.31%
5711
30
1
2
1
2
54.46%
7500
50
1
0.9
1
1
693
0.125
172
46.22%
45.05%
2500
45
1
0.833333333
0.275
1
1
1
0.5
10
1900
30
1
1
0.466666667 0.666667
1
1
1
1
200
0.6
1
29.85%
3266
40
1.32
0.93
1
1
3
517 0.277778 0.333333
23.89%
3000
40
0.8
0.4
1
1
2
286
1
1
0.
128 0.166667 0.833333
43 0.285714 0.428571
1 0.666667
74 0.777778 0.222222
36.94%
3000
40
1
1
0.45
0.6
1
1
1
3
0.25
1 0.833333
10.48%
791
25
1
1
1
1
1
37.84%
325
25
4
4
1
55
4 3.769231
4.444444444 3.615385
2.888888889 3.692308
4.222222222 4.538462
3.444444444
4.222222222 3.923077
3.888888889 4.076923
3.888888889 4.153846
3.333333333 3.923077
30.96%
2312
20
0.96
0.8
1
1
0.
2
26.80%
1230
35
1
1
0.5
0.4
1
1
4
84
0.2
1
193 0.428571
276 0.777778 0.888889
166 0.214286 0.857143
742
324 0.428571 0.857143
320 0.461538 0.615385
161 0.428571
1.057142857| 0.909091
0.84 0.882353
38.89%
1800
30
1
1
1
1
0.285714
7
38.24%
12000
45
1
1
1
1
3
41.67%
3995
35
1
4
0.95
0.6
1
1
3
24.49%
3100
50
1
0.4
1
0.
1
1 0.555556
0.
31.35%
3277
35
1
1.022222222 0.782609
1
1
63.55%
8000
45
1
1
0.833333333
1
3
44.55%
7000
43
2
0.933333333 0.857143
1
1
1
OO O
2.

Transcribed Image Text:Refer to the "school passing rate" data set. Address each of the following. Use 0.05 level
of significance for each. Answer the following questions.(you can use excel or compute
in manually) Please show your solution
1) Determine if more than half of the schools in the population require high school grades?
Expert Solution
This question has been solved!
Explore an expertly crafted, step-by-step solution for a thorough understanding of key concepts.

Step by stepSolved in 2 steps with 3 images

Knowledge Booster

Similar questions
- What do between-rows sum of squares equals to?arrow_forwardRapididentity O Course Modules: E x O Study Guide 2 E Copy of Consecutiv x 9 Course Modules: L Copy of Study Guic x s.google.com/document/d/1inhYXNuH5u5ovUcdd8rlBPmFOFPgq4uxtDOuGEHXQOA/edit Movies Onli. A Dashboard A Desmos | Beautiful, 17. Fill in the values in the boxes to make Equation 2 equivalent to Equation 1: Equation 1: -3x + 4y = 2 Equation 2: 中 y D Box 1 Box 2arrow_forwardU Digital University | UMGC McGraw Hill Campus - MATH 105 X A ALEKS - Denay Harris - Knowledg X + A www-awu.aleks.com/alekscgi/x/Isl.exe/1o_u-IgNslkr7j8P3jH-IQ1gtxjJpdyps2nJxZ_kvzXfsB26H8ZG13mFuqHw30XTF9bGCwmD8jp-elfUoyRRH.. 2 Update Knowledge Check Question 5 Denay Español Answer each part. If necessary, round your answers to the nearest hundredth. (a) A color printer prints 27 pages in 9 minutes. ? How many pages does it print per minute? O pages per minute (b) At Hoffman's Bike Rentals, it costs $34 to rent a bike for 9 hours. How many hours of bike use does a customer get per dollar? |hours per dollar I Don't Know Submit © 2022 McGraw Hill LLC. AIIL Rights Reserved. Terms of Use Privacy Center | Accessibility 8:40 PM 2 Type here to search W 5/6/2022 22arrow_forward
arrow_back_ios
arrow_forward_ios
Recommended textbooks for you
- MATLAB: An Introduction with ApplicationsStatisticsISBN:9781119256830Author:Amos GilatPublisher:John Wiley & Sons Inc
 Probability and Statistics for Engineering and th...StatisticsISBN:9781305251809Author:Jay L. DevorePublisher:Cengage Learning
 Statistics for The Behavioral Sciences (MindTap C...StatisticsISBN:9781305504912Author:Frederick J Gravetter, Larry B. WallnauPublisher:Cengage Learning
  Elementary Statistics: Picturing the World (7th E...StatisticsISBN:9780134683416Author:Ron Larson, Betsy FarberPublisher:PEARSON
 The Basic Practice of StatisticsStatisticsISBN:9781319042578Author:David S. Moore, William I. Notz, Michael A. FlignerPublisher:W. H. Freeman
 Introduction to the Practice of StatisticsStatisticsISBN:9781319013387Author:David S. Moore, George P. McCabe, Bruce A. CraigPublisher:W. H. Freeman
MATLAB: An Introduction with Applications
Statistics
ISBN:9781119256830
Author:Amos Gilat
Publisher:John Wiley & Sons Inc
Probability and Statistics for Engineering and th...
Statistics
ISBN:9781305251809
Author:Jay L. Devore
Publisher:Cengage Learning
Statistics for The Behavioral Sciences (MindTap C...
Statistics
ISBN:9781305504912
Author:Frederick J Gravetter, Larry B. Wallnau
Publisher:Cengage Learning
Elementary Statistics: Picturing the World (7th E...
Statistics
ISBN:9780134683416
Author:Ron Larson, Betsy Farber
Publisher:PEARSON
The Basic Practice of Statistics
Statistics
ISBN:9781319042578
Author:David S. Moore, William I. Notz, Michael A. Fligner
Publisher:W. H. Freeman
Introduction to the Practice of Statistics
Statistics
ISBN:9781319013387
Author:David S. Moore, George P. McCabe, Bruce A. Craig
Publisher:W. H. Freeman