
MATLAB: An Introduction with Applications
6th Edition
ISBN: 9781119256830
Author: Amos Gilat
Publisher: John Wiley & Sons Inc
expand_more
expand_more
format_list_bulleted
Related questions
Question
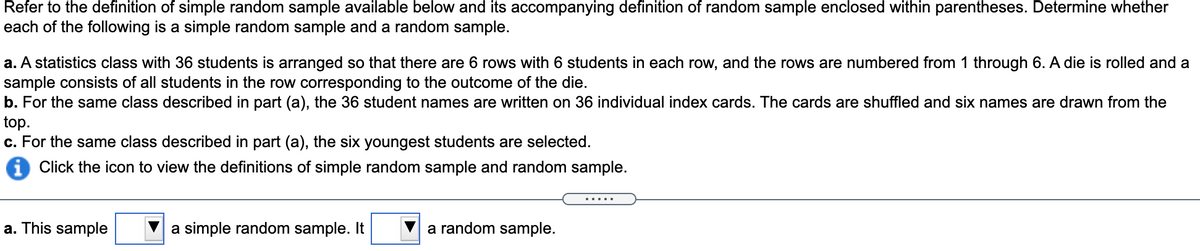

Transcribed Image Text:Refer to the definition of simple random sample available below and its accompanying definition of random sample enclosed within parentheses. Determine whether
each of the following is a simple random sample and a random sample.
a. A statistics class with 36 students is arranged so that there are 6 rows with 6 students in each row, and the rows are numbered from 1 through 6. A die is rolled and a
sample consists of all students in the row corresponding to the outcome of the die.
b. For the same class described in part (a), the 36 student names are written on 36 individual index cards. The cards are shuffled and six names are drawn from the
top.
c. For the same class described in part (a), the six youngest students are selected.
Click the icon to view the definitions of simple random sample and random sample.
a. This sample
a simple random sample. It
a random sample.
Expert Solution
This question has been solved!
Explore an expertly crafted, step-by-step solution for a thorough understanding of key concepts.

This is a popular solution

Trending nowThis is a popular solution!

Step by stepSolved in 4 steps

Knowledge Booster

Similar questions
- Please answer the question on the photo.arrow_forwardRace organizers want to survey the participating runners on the quality of the running course. Which of the following uses systematic random sampling? Select the first 15 finishers and the last 15 finishers to take the survey. Randomly select 15% of the male participants and 15% of the female participants. Select the 5th finisher (with the number 5 being randomly chosen) to survey, then survey every 15th finisher after that. Sort all of the runners' names alphabetically, then randomly choose 2 letters and survey all participants whose last name begins with one of those letters.arrow_forwardThe instructor takes a random sample of size from the population data and obtains the following sample data: x 405 385 495 385 555 470 5 If we take random samples of size n = 6 from this population, the number of possible samples is: a 11,481,019,312 b 11,367,345,853 c 11,254,797,874 d 11,143,364,232arrow_forward
- . List the 10 possible samples (without replacement) of size 2 that can be obtained from the population of five officials. Lieutenant Governor (L) Secretary of State (S) Attorney General (A) Representative (R) Press Secretary (P) b. If a simple random sampling procedure is used to obtain a sample of two officials, what are the chances that it is the first sample on your list in part (a)? the secondsample? the tenth sample?arrow_forwardSuppose you are the president of the student government. You wish to conduct a survey to determine the student body's opinion regarding student services. The administration provides you with a list of the names and phone numbers of thE 731 registered students. Obtain this sample using the portion of the random number table provided in the problem statement. Start with the first column of the first row and work down each column. Type the numbers corresponding to the students chosen. enter your response here (Use a comma to separate answers as needed.) random number table 90279, 9589802995, 4831398541, 7094488592, 7953872868, 2655418909, 2433671255, 7867063390, 9301465701, 1124677814, 33522arrow_forwardneed helparrow_forward
- Refer to the following scenario. A government official is in charge of allocating social programs throughout the city of Vancouver. He will decide where these social outreach programs should be located based on the percentage of residents living below the poverty line in each region of the city. He takes a simple random sample of 120 people living in Gastown and finds that 21 have an annual income that is below the poverty line. For each of the following statements, specify whether the statement is a correct interpretation of the 95% confidence interval for the true proportion of Gastown residents living below the poverty line. A. 17.50% (21/120) of Gastown residents are living below the poverty line. ? B. There is a 95% probability that the true proportion of Gastown residents who are living below the poverty line equals 21/120. C. If another random sample of 120 Gastown residents is drawn, there is a 95% probability that the sample proportion of Gastown residents who are living below…arrow_forwardRefer to the following scenario. A government official is in charge of allocating social programs throughout the city of Vancouver. He will decide where these social outreach programs should be located based on the percentage of residents living below the poverty line in each region of the city. He takes a simple random sample of 123 people living in Gastown and finds that 24 have an annual income that is below the poverty line. For each of the following statements, specify whether the statement is a correct interpretation of the 95% confidence interval for the true proportion of Gastown residents living below the poverty line. A. 19.51% (24/123) of Gastown residents are living below the poverty line. ? + B. There is a 95% probability that the true proportion of Gastown residents who are living below the poverty line equals 24/123. ? + C. If another random sample of 123 Gastown residents is drawn, there is a 95% probability that the sample proportion of Gastown residents who are living…arrow_forwardFortune publishes data on sales, profits, assets, stockholders' equity, market value, and earnings per share for the 500 largest U.S. industrial corporations every year. Assume that you want to select a simple random sample of 10 corporations from the Fortune 500 list. Use the last three digits in column 10 of the table of random numbers, beginning with 945. Read down the column and identify the numbers of the 10 corporations that would be selected. (Enter your answers as a comma-separated list.)arrow_forward
arrow_back_ios
arrow_forward_ios
Recommended textbooks for you
- MATLAB: An Introduction with ApplicationsStatisticsISBN:9781119256830Author:Amos GilatPublisher:John Wiley & Sons Inc
 Probability and Statistics for Engineering and th...StatisticsISBN:9781305251809Author:Jay L. DevorePublisher:Cengage Learning
 Statistics for The Behavioral Sciences (MindTap C...StatisticsISBN:9781305504912Author:Frederick J Gravetter, Larry B. WallnauPublisher:Cengage Learning
  Elementary Statistics: Picturing the World (7th E...StatisticsISBN:9780134683416Author:Ron Larson, Betsy FarberPublisher:PEARSON
 The Basic Practice of StatisticsStatisticsISBN:9781319042578Author:David S. Moore, William I. Notz, Michael A. FlignerPublisher:W. H. Freeman
 Introduction to the Practice of StatisticsStatisticsISBN:9781319013387Author:David S. Moore, George P. McCabe, Bruce A. CraigPublisher:W. H. Freeman
MATLAB: An Introduction with Applications
Statistics
ISBN:9781119256830
Author:Amos Gilat
Publisher:John Wiley & Sons Inc
Probability and Statistics for Engineering and th...
Statistics
ISBN:9781305251809
Author:Jay L. Devore
Publisher:Cengage Learning
Statistics for The Behavioral Sciences (MindTap C...
Statistics
ISBN:9781305504912
Author:Frederick J Gravetter, Larry B. Wallnau
Publisher:Cengage Learning
Elementary Statistics: Picturing the World (7th E...
Statistics
ISBN:9780134683416
Author:Ron Larson, Betsy Farber
Publisher:PEARSON
The Basic Practice of Statistics
Statistics
ISBN:9781319042578
Author:David S. Moore, William I. Notz, Michael A. Fligner
Publisher:W. H. Freeman
Introduction to the Practice of Statistics
Statistics
ISBN:9781319013387
Author:David S. Moore, George P. McCabe, Bruce A. Craig
Publisher:W. H. Freeman