ENGR.ECONOMIC ANALYSIS
14th Edition
ISBN: 9780190931919
Author: NEWNAN
Publisher: Oxford University Press
expand_more
expand_more
format_list_bulleted
Question

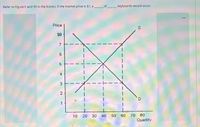
Transcribed Image Text:Refer to Figure E and fill in the blanks. If the market price is $7, a
of
keyboards would occur.
Price
$8
7
2
70 80
Quantitv
10
20
30
40
50 60
4,
3.
Expert Solution
This question has been solved!
Explore an expertly crafted, step-by-step solution for a thorough understanding of key concepts.
Step by stepSolved in 2 steps

Knowledge Booster
Learn more about
Need a deep-dive on the concept behind this application? Look no further. Learn more about this topic, economics and related others by exploring similar questions and additional content below.Similar questions
- The Unique Gifts catalog lists a "super loud and vibrating alarm clock." Their records indicate the following information on the relation of monthly supply and demand quantities to the price of the clock. Demand Supply Price 166 131 $31 146 181 $43 Use this information to find the following. (a) points on the demand linear equation (x, p) (smaller x-value) (х, р) %3 (larger x-value) points on the supply linear equation (х, р) (smaller x-value) (x, p) = ( ) (larger x-value) (b) the demand equation p = (c) the supply equation p (d) the equilibrium quantity and price Equilibrium occurs when the price of the clock is $ and the quantity isarrow_forward04. The maximum that buyers are willing to pay for the 8-th unit of this product is (a) $4 (b) $12 (c) $18 (d) $22 (e) $24 05. The minimum that suppliers will accept for the twentieth unit of this product is (a) $2 (b) $8 (c) $12 (d) $18 (e) $22 06. Assuming that this market is at equilibrium, what is the "consumer's surplus" and producer's surplus? (a) consumer's surplus is $72; producer's surplus is $36 (b) consumer's surplus is $98; producer's surplus is $49 (c) consumer's surplus is $32; producer's surplus is $16 (d) consumer's surplus is $36; producer's surplus is $72 (e) consumer's surplus is $144; producer's surplus is $14arrow_forward21. 11. A store is having a massive sale on margarine. What happens to the demand for the substitute item called butter-show on a demand graph. Label everything always.arrow_forward
- Use the green rectangle (triangle symbols) to compute total revenue at various prices along the demand curve. Note: You will not be graded on any changes made to this graph. PRICE (Dollars per scooter) 325 300 275 250 225 200 175 150 125 100 75 50 25 0 09 18 27 A + 36 45 54 63 72 81 QUANTITY (Scooters) B Demand 90 90 99 108 117 Total Revenue ?arrow_forwardThe quantity supplied of a good isA) equal to the difference between the quantity available and the quantity desired by all consumers and producers.B) the same thing as the quantity demanded at each price.C) the amount that the producers are planning to sell at a particular price during a given time period.D) the amount the firm would sell if it faced no resource constraints.arrow_forwardThe price of gasoline is currently $3.94, this is a 23% increase from a year ago. What was the price of gas a year ago.arrow_forward
- Use the demand curve below to answer questions 1 through 6. price 12- 10- 8 6- 4- 2- 0 0 50 100 150 200 250 quantity What is the percent change in price when the price drops from $6 to $5? Assume your answer is a percent and enter a numeric value only.arrow_forwardSilicon is an important input in the production of computer chips. If the price of silicon decreases, then we would expect the supply of computer chips to increase. computer chips to decrease. computer chips to be unaffected. ooo silicon to increase.arrow_forwardDollars 200 0 f XMR g hj Output D MC 41) Refer to the diagram. Equilibrium price is A) c. B) d. C) b. D) e. ATCarrow_forward
- 1) The cost of satellite internet drops. How will this impact the supply and demand for cable internet? Explain. 2) Consider Question 1. Graph any changes you describe. Be sure to include the change in equilibrium.arrow_forwardQuestion 18 In the diagrams below, the subscript "1" refers to the initial position of the curve, while the subscript "2" refers to the final position after the curve shifts, D2 -D1 D, (A) (B) P. D Q. (C) (D) Which diagram above illustrates the effect on the natural-gas market, with the widespread use of "fracking" or hydraulic fracturing by gas-drilling companies O Aarrow_forwardThe following table contains a monthly demand schedule for pizzas. Price Quantity Demanded $10 A $15 30 If the law of demand applies to these pizzas, then A could be a) 15b) 20c) 0d) 45arrow_forward
arrow_back_ios
SEE MORE QUESTIONS
arrow_forward_ios
Recommended textbooks for you

 Principles of Economics (12th Edition)EconomicsISBN:9780134078779Author:Karl E. Case, Ray C. Fair, Sharon E. OsterPublisher:PEARSON
 Engineering Economy (17th Edition)EconomicsISBN:9780134870069Author:William G. Sullivan, Elin M. Wicks, C. Patrick KoellingPublisher:PEARSON
 Principles of Economics (MindTap Course List)EconomicsISBN:9781305585126Author:N. Gregory MankiwPublisher:Cengage Learning
 Managerial Economics: A Problem Solving ApproachEconomicsISBN:9781337106665Author:Luke M. Froeb, Brian T. McCann, Michael R. Ward, Mike ShorPublisher:Cengage Learning
 Managerial Economics & Business Strategy (Mcgraw-...EconomicsISBN:9781259290619Author:Michael Baye, Jeff PrincePublisher:McGraw-Hill Education


Principles of Economics (12th Edition)
Economics
ISBN:9780134078779
Author:Karl E. Case, Ray C. Fair, Sharon E. Oster
Publisher:PEARSON

Engineering Economy (17th Edition)
Economics
ISBN:9780134870069
Author:William G. Sullivan, Elin M. Wicks, C. Patrick Koelling
Publisher:PEARSON

Principles of Economics (MindTap Course List)
Economics
ISBN:9781305585126
Author:N. Gregory Mankiw
Publisher:Cengage Learning

Managerial Economics: A Problem Solving Approach
Economics
ISBN:9781337106665
Author:Luke M. Froeb, Brian T. McCann, Michael R. Ward, Mike Shor
Publisher:Cengage Learning

Managerial Economics & Business Strategy (Mcgraw-...
Economics
ISBN:9781259290619
Author:Michael Baye, Jeff Prince
Publisher:McGraw-Hill Education