MATLAB: An Introduction with Applications
6th Edition
ISBN: 9781119256830
Author: Amos Gilat
Publisher: John Wiley & Sons Inc
expand_more
expand_more
format_list_bulleted
Question
thumb_up100%

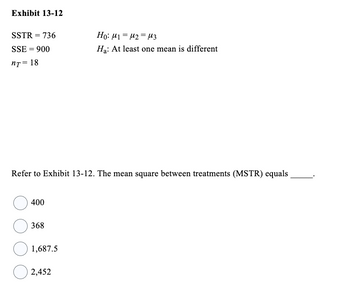
Transcribed Image Text:**Exhibit 13-12**
- SSTR = 736
- SSE = 900
- \( n_T = 18 \)
**Hypotheses:**
- \( H_0: \mu_1 = \mu_2 = \mu_3 \)
- \( H_a: \) At least one mean is different
**Question:**
Refer to Exhibit 13-12. The mean square between treatments (MSTR) equals _____.
Choices:
- ○ 400
- ○ 368
- ○ 1,687.5
- ○ 2,452
Expert Solution
This question has been solved!
Explore an expertly crafted, step-by-step solution for a thorough understanding of key concepts.
This is a popular solution
Trending nowThis is a popular solution!
Step by stepSolved in 2 steps

Knowledge Booster
Similar questions
- Find the percentage of area under a normal curve between the mean and the given number of standard deviations from the mean. This problem can be solved using technology or the table for the standard normal curve from your text. −0.4 The percentage of area under the normal curve between the mean and −0.4 standard deviations from the mean isarrow_forwardAutoTrader.com would like to test if a difference exists in the age of three different types of vehicles currently on the road: trucks, cars, and vans. The following data represent the age of a random sample of trucks, cars, and vans. Trucks | Cars Vans 10 10 4 11 11 12 14 7 11 12 The mean square for treatments (MSTR) for these observations isarrow_forwardThe ? of a distribution of scores for a ? is measured by the variability. a- mode; symmetry b- variance; variability c- mean; modality d- standard deviation; variabilityarrow_forward
- This problem is fill in the blank. Just choose the correct answers. Thank you for your help A coin-operated coffee machine made by BIG Corporation was designed to discharge a mean of 7.3 ounces of coffee per cup. If it dispenses more than that on average, the corporation may lose money, and if it dispenses less, the customers may complain. Believing that the mean amount of coffee dispensed by the machine, μ, is less than 7.3 ounces, BIG plans to perform a statistical test of the claim that the machine is working as designed. Technicians gather a random sample of fill amounts and find that the mean of the sample is 7.1 ounces and that the standard deviation is 0.3 ounces. Based on this information, answer the questions below. 1. What are the null hypothesis (H0) and the alternative hypothesis (H1) that should be used for the test? H0: (choose one) less than, less than or equal to, greater than, greater than or equal to, equal to, or not equal to. (choose one) 7.1…arrow_forwardTrue or false - The number of languages a person can speak is a nominal variable, therefore we cannot calculate its median.arrow_forwardOnly parts B and C please. Thank you.arrow_forward
- rue or False? Assume a researcher recruits 150 African American and Caucasian individuals taking warfarin to determine if there is a difference in the mean dosage of the medication needed to cause a decrease in their INR blood test. If the mean dosage for 75 Caucasian individuals required to get their INR blood test in range is 6.1 mg with a standard deviation of 1.7 mg and the mean dosage for 75 African American individuals required to get their INR blood test in range is 4.3 mg with a standard deviation of 0.9 mg, the z value obtained while calculating the test statistic is approximately 9.60. True Falsearrow_forwardPlease provide only typed answer solution no handwritten solution needed allowedarrow_forwardSuppose X - N (8, 2). Between what a values does 68.22% of the data lie? The range of x values is centered at the mean of the distribution (i.e., 8). Enter your answers in increasing order, to the nearest integer. 68.22% of the data lie between Number and Numberarrow_forward
arrow_back_ios
SEE MORE QUESTIONS
arrow_forward_ios
Recommended textbooks for you
 MATLAB: An Introduction with ApplicationsStatisticsISBN:9781119256830Author:Amos GilatPublisher:John Wiley & Sons Inc
 Probability and Statistics for Engineering and th...StatisticsISBN:9781305251809Author:Jay L. DevorePublisher:Cengage Learning
 Statistics for The Behavioral Sciences (MindTap C...StatisticsISBN:9781305504912Author:Frederick J Gravetter, Larry B. WallnauPublisher:Cengage Learning
 Elementary Statistics: Picturing the World (7th E...StatisticsISBN:9780134683416Author:Ron Larson, Betsy FarberPublisher:PEARSON
 The Basic Practice of StatisticsStatisticsISBN:9781319042578Author:David S. Moore, William I. Notz, Michael A. FlignerPublisher:W. H. Freeman
 Introduction to the Practice of StatisticsStatisticsISBN:9781319013387Author:David S. Moore, George P. McCabe, Bruce A. CraigPublisher:W. H. Freeman

MATLAB: An Introduction with Applications
Statistics
ISBN:9781119256830
Author:Amos Gilat
Publisher:John Wiley & Sons Inc

Probability and Statistics for Engineering and th...
Statistics
ISBN:9781305251809
Author:Jay L. Devore
Publisher:Cengage Learning

Statistics for The Behavioral Sciences (MindTap C...
Statistics
ISBN:9781305504912
Author:Frederick J Gravetter, Larry B. Wallnau
Publisher:Cengage Learning

Elementary Statistics: Picturing the World (7th E...
Statistics
ISBN:9780134683416
Author:Ron Larson, Betsy Farber
Publisher:PEARSON

The Basic Practice of Statistics
Statistics
ISBN:9781319042578
Author:David S. Moore, William I. Notz, Michael A. Fligner
Publisher:W. H. Freeman

Introduction to the Practice of Statistics
Statistics
ISBN:9781319013387
Author:David S. Moore, George P. McCabe, Bruce A. Craig
Publisher:W. H. Freeman