
MATLAB: An Introduction with Applications
6th Edition
ISBN: 9781119256830
Author: Amos Gilat
Publisher: John Wiley & Sons Inc
expand_more
expand_more
format_list_bulleted
Related questions
Question
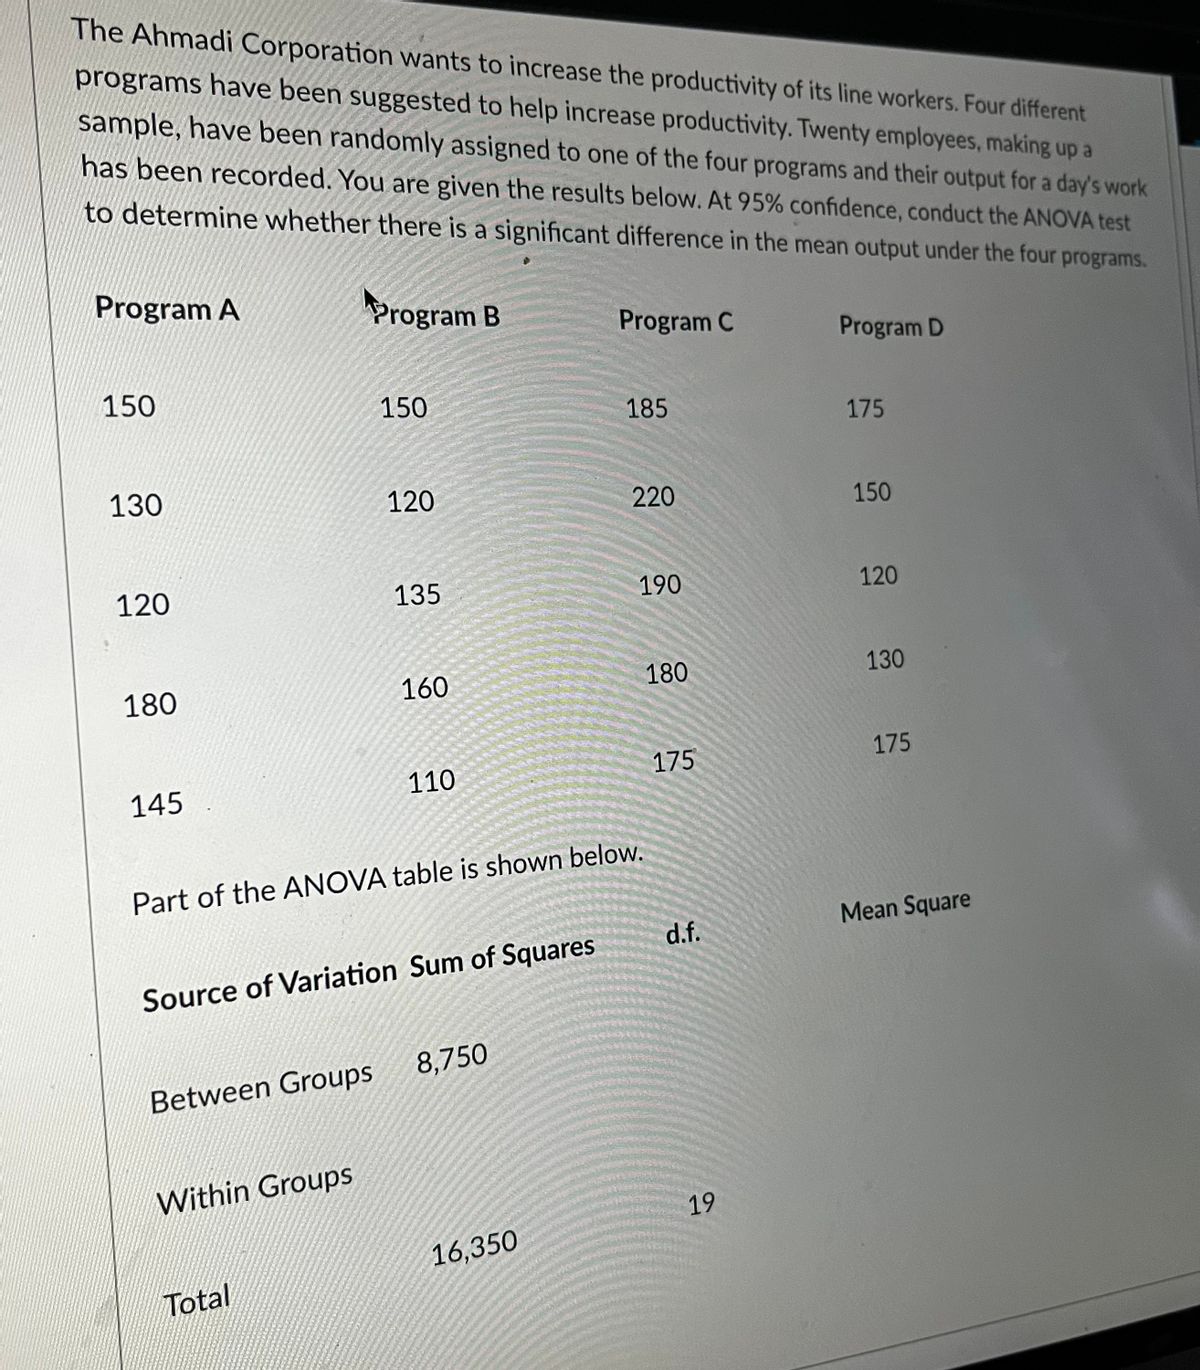

Transcribed Image Text:The Ahmadi Corporation wants to increase the productivity of its line workers. Four different
programs have been suggested to help increase productivity. Twenty employees, making up a
sample, have been randomly assigned to one of the four programs and their output for a day's work
has been recorded. You are given the results below. At 95% confidence, conduct the ANOVA test
to determine whether there is a significant difference in the mean output under the four programs.
Program A
Program B
Program C
Program D
150
150
185
175
130
120
120
135
180
160
145
110
Part of the ANOVA table is shown below.
Source of Variation Sum of Squares
8,750
Between Groups
Within Groups
16,350
Total
220
190
180
175
d.f.
19
150
120
130
175
Mean Square

Transcribed Image Text:Refer to Exhibit 1. The mean square error is
O 475
860.53
2916.67
O8750
Expert Solution
This question has been solved!
Explore an expertly crafted, step-by-step solution for a thorough understanding of key concepts.

This is a popular solution

Trending nowThis is a popular solution!

Step by stepSolved in 2 steps with 2 images

Knowledge Booster

Similar questions
- Use the standard normal table to find the z-score that corresponds to the cumulative area 0.0150. If the area is not in the table, use the entry closest to the area. If the area is halfway between two entries, use the z-score halfway between the corresponding z-scores. Click to view page 1 of the standard normal table. Click to view page 2 of the standard normal table. (Type an integer or decimal rounded to three decimal places as needed.) Enter your answer in the answer box.arrow_forwardThe number of bpms (bits per microseconds) passed through a gate is given below. Find the median bpms. 70 60 50 61 78 32 73 28 39 19 63arrow_forwardUse the standard normal table to find the z-score that corresponds to the cumulative area 0.1047. If the area is not in the table, use the entry closest to the area. If the area is halfway between two entries, use the z-score halfway between the corresponding z-scores. Click to view page 1 of the standard normal table. Click to view page 2 of the standard normal table. (Type an integer or decimal rounded to three decimal places as needed.)arrow_forward
- Use the standard normal table to find the z-score that corresponds to the cumulative area 0.7673. If the area is not in the table, use the entry closest to the area. If the area is halfway between two entries, use the z-score halfway between the corresponding z-scores. Click to view page 1 of the standard normal table. Click to view page 2 of the standard normal table. (Type an integer or decimal rounded to three decimal places as needed.)arrow_forwardCalculate the standard deviation of 2,3,3,3,9.arrow_forwardUse the standard normal table to find the z-score that corresponds to the cumulative area 0.8962. If the area is not in the table, use the entry closest to the area. If the area is halfway between two entries, use the z-score halfway between the corresponding z-scores. Click to view page 1 of the standard normal table. Click to view page 2 of the standard normal table. =(Type an integer or decimal rounded to three decimal places as needed.)arrow_forward
- Use the standard normal table to find the z-score that corresponds to the cumulative area 0.9616. If the area is not in the table, use the entry closest to the area. If the area is halfway between two entries, use the z-score halfway between the corresponding z-scores. Click to view page 1 of the standard normal table. Click to view page 2 of the standard normal table. (Type an integer or decimal rounded to three decimal places as needed.) - X - X Standard normal table (page 1) Standard normal table (page 2) - 3.3 .0004 0005 .0003 .0004 .0004 .0004 .0004 .0004 .0005 .0005 .0005 0.2 .5793 .5832 .5871 .5910 .5948 .5987 .6026 .6064 .6103 .6141 - 3.2 .0005 .0005 .0006 .0006 .0006 .0006 .0006 .0007 .0007 0.3 .6179 .6217 .6255 .6293 .6331 .6368 .6406 .6443 .6480 .6517 3.1 .0007 .0007 .0008 .0008 .0008 .0008 .0009 .0009 .0009 .0010 0.4 .6554 .6591 .6628 .6700 .6736 .6772 .6808 .6844 .6879 .6664 - 3.0 – 2.9 .0010 .0010 .0011 .0011 .0011 .0012 .0012 .0013 .0013 .0013 .6915 .7019 .7088 .7422…arrow_forwardNeed help. Will give thumbs up! Data typed below. Thank you! TSERofReturn AcmeRofReturn -1.99167 -1.03712 2.64815 3.04528 -0.58856 0.44802 -0.76395 0.60781 -0.81178 2.51735 -0.14212 1.70972 0.17677 -0.27609 0.54349 1.18672 -0.09428 0.49632 0.3681 -3.08347 0.60727 1.4182 1.3726 0.1878 -0.8915 -1.81699 1.8031 0.975 -0.26967 1.85853 2.42493 2.33005 -0.95528 -0.48742 -0.28562 -0.15591 -2.13517 -1.67924 -0.85961 1.57905 1.0856 -4.09194 -1.06689 -0.43368 0.04922 1.22281 3.2381 -0.55675 1.05371 -0.23124 -1.1785 -5.10525 1.11749 0.5909 -0.01456 1.70857 1.13344 0.93883 2.6641 0.92507 -1.33795 0.9294 -1.65683 -1.93668 -2.21489 -5.10648 -1.19445 0.47456 -0.461 0.19373 0.6551 -0.44915 1.5161 -1.11084 3.42943 2.58471 -0.3175 1.17337 -0.47695 -1.08238…arrow_forwardIn one of the Stat 2 sections, the students in the section have an average height of 64 inches, with a standard deviation of 3 inches. The GSI happens to be 68 inches. Express the height of the GSI in standard units, relative to the students in the section. Choose the answer below that is closest. Group of answer choices 1.67 3.0 1.5 1.33 4.0 PreviousNextarrow_forward
- Use the standard normal table to find the z-score that corresponds to the cumulative area 0.0129. If the area is not in the table, use the entry closest to the area. If the area is halfway between two entries, use the z-score halfway between the corresponding z-scores. Click to view page 1 of the standard normal table. Click to view page 2 of the standard normal table. (Type an integer or decipaall eaundad to thcee deeisel elese apeaded - X Standard normal table (page 2) Standard normal table (page 1) Standard Normal Distribution Standard Normal Distribution Critical Values Critical Values Level of Confidence c Level of Confidence c 0.80 1.28 0.80 1.28 0.90 1.645 Area 0.90 1.645 0.95 1.96 0.95 1.96 0.99 2.575 0.99 2.575 .00 .01 .02 .03 .04 .05 .06 .07 .08 .09 .09 .08 .07 .06 05 .04 .03 .02 .01 .00 0.0 .5000 .5040 .5080 .5120 .5160 .5199 .5239 .5279 .5319 .5359 - 3.4 - 3.3 - 3.2 - 3.1 - 3.0 - 2.9 .0002 .0003 .0003 .0003 .0003 .0003 .0003 .0003 .0003 .0003 0.1 .5398 .5438 .5478 .5517…arrow_forwardFind the area of the shaded region. The graph to the right depicts IQ scores of adults, and those scores are normally distributed with a mean of 100 and a standard deviation of 15. The area of the shaded region is needed.) 108 122 (Round to four decimal places as Oarrow_forwardDescribe about MEAN SQUARE (M S ) AND THE F RATIO.arrow_forward
arrow_back_ios
SEE MORE QUESTIONS
arrow_forward_ios
Recommended textbooks for you
- MATLAB: An Introduction with ApplicationsStatisticsISBN:9781119256830Author:Amos GilatPublisher:John Wiley & Sons Inc
 Probability and Statistics for Engineering and th...StatisticsISBN:9781305251809Author:Jay L. DevorePublisher:Cengage Learning
 Statistics for The Behavioral Sciences (MindTap C...StatisticsISBN:9781305504912Author:Frederick J Gravetter, Larry B. WallnauPublisher:Cengage Learning
  Elementary Statistics: Picturing the World (7th E...StatisticsISBN:9780134683416Author:Ron Larson, Betsy FarberPublisher:PEARSON
 The Basic Practice of StatisticsStatisticsISBN:9781319042578Author:David S. Moore, William I. Notz, Michael A. FlignerPublisher:W. H. Freeman
 Introduction to the Practice of StatisticsStatisticsISBN:9781319013387Author:David S. Moore, George P. McCabe, Bruce A. CraigPublisher:W. H. Freeman
MATLAB: An Introduction with Applications
Statistics
ISBN:9781119256830
Author:Amos Gilat
Publisher:John Wiley & Sons Inc
Probability and Statistics for Engineering and th...
Statistics
ISBN:9781305251809
Author:Jay L. Devore
Publisher:Cengage Learning
Statistics for The Behavioral Sciences (MindTap C...
Statistics
ISBN:9781305504912
Author:Frederick J Gravetter, Larry B. Wallnau
Publisher:Cengage Learning
Elementary Statistics: Picturing the World (7th E...
Statistics
ISBN:9780134683416
Author:Ron Larson, Betsy Farber
Publisher:PEARSON
The Basic Practice of Statistics
Statistics
ISBN:9781319042578
Author:David S. Moore, William I. Notz, Michael A. Fligner
Publisher:W. H. Freeman
Introduction to the Practice of Statistics
Statistics
ISBN:9781319013387
Author:David S. Moore, George P. McCabe, Bruce A. Craig
Publisher:W. H. Freeman