ENGR.ECONOMIC ANALYSIS
14th Edition
ISBN: 9780190931919
Author: NEWNAN
Publisher: Oxford University Press
expand_more
expand_more
format_list_bulleted
Question
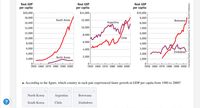
Please see photos for tables and questions to be answered !

Transcribed Image Text:Real GDP
Real GDP
Real GDP
per capita
per capita
per capita
$20,000
$14,000
$10,000
18,000
9,000
South Korea
12,000
Botswana
16,000
Argentina
8,000
14,000
10,000
7,000
12,000
6,000
8,000
10,000
Chile
5,000
6,000
8,000
4,000
6,000
4,000
3,000
Zimbabwe
4,000
2,000
North Korea
2,000
2,000
1,000
1950 1960 1970 1980 1990 2000
1950 1960 1970 1980 1990 2000
1950 1960 1970 1980 1990 2000
a. According to the figure, which country in each pair experienced faster growth in GDP per capita from 1980 to 2000?
North Korea
Argentina
Botswana
South Korea
Chile
Zimbabwe
nternational Economics, 5e © 2021 Worth Publishers

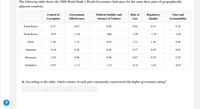
Transcribed Image Text:The following table shows the 2000 World Bank's World Governance Indicators for the same three pairs of geographically
adjacent countries.
Control of
Government
Political Stability and
Rule of
Regulatory
Voice and
Corruption
Effectiveness
Absence of Violence
Law
Quality
Accountability
South Korea
0.37
0.63
0.49
0.64
0.47
0.76
North Korea
-0.93
-1.10
-066
-1.08
-1.70
-2.02
Chile
1.56
1.34
0.85
1.31
1.38
0.56
Argentina
-0.34
0.28
0.48
0.17
0.45
0.44
Botswana
1.02
0.98
0.90
0.67
0.79
0.78
Zimbabwe
-0.87
-1.13
-1.21
-0.74
-1.61
-0.97
b. According to the table, which country in each pair consistently experienced the higher governance rating?
Expert Solution
This question has been solved!
Explore an expertly crafted, step-by-step solution for a thorough understanding of key concepts.
Step by stepSolved in 2 steps

Knowledge Booster
Learn more about
Need a deep-dive on the concept behind this application? Look no further. Learn more about this topic, economics and related others by exploring similar questions and additional content below.Similar questions
- My homework help What happens in the market for beach towels now that the season is over. Graph and explainarrow_forwardWhat would be required for consumers to have the necessary knowledge about a product and how it was made so that they could make an informed and ethical decision? The media? Commercial watchdog groups? Social-issues campaigns? Something else?arrow_forwardWhere does Mark Dean call home?arrow_forward
- Why do people share content via social media channels? They find it interesting and/or entertaining. They think it can be helpful to others. They want to get a laugh. A & B Only. All of these.arrow_forwardwhat are types of savigs vehiclesarrow_forwardName the three general categories of Resourcesarrow_forward
arrow_back_ios
arrow_forward_ios
Recommended textbooks for you

 Principles of Economics (12th Edition)EconomicsISBN:9780134078779Author:Karl E. Case, Ray C. Fair, Sharon E. OsterPublisher:PEARSON
 Engineering Economy (17th Edition)EconomicsISBN:9780134870069Author:William G. Sullivan, Elin M. Wicks, C. Patrick KoellingPublisher:PEARSON
 Principles of Economics (MindTap Course List)EconomicsISBN:9781305585126Author:N. Gregory MankiwPublisher:Cengage Learning
 Managerial Economics: A Problem Solving ApproachEconomicsISBN:9781337106665Author:Luke M. Froeb, Brian T. McCann, Michael R. Ward, Mike ShorPublisher:Cengage Learning
 Managerial Economics & Business Strategy (Mcgraw-...EconomicsISBN:9781259290619Author:Michael Baye, Jeff PrincePublisher:McGraw-Hill Education


Principles of Economics (12th Edition)
Economics
ISBN:9780134078779
Author:Karl E. Case, Ray C. Fair, Sharon E. Oster
Publisher:PEARSON

Engineering Economy (17th Edition)
Economics
ISBN:9780134870069
Author:William G. Sullivan, Elin M. Wicks, C. Patrick Koelling
Publisher:PEARSON

Principles of Economics (MindTap Course List)
Economics
ISBN:9781305585126
Author:N. Gregory Mankiw
Publisher:Cengage Learning

Managerial Economics: A Problem Solving Approach
Economics
ISBN:9781337106665
Author:Luke M. Froeb, Brian T. McCann, Michael R. Ward, Mike Shor
Publisher:Cengage Learning

Managerial Economics & Business Strategy (Mcgraw-...
Economics
ISBN:9781259290619
Author:Michael Baye, Jeff Prince
Publisher:McGraw-Hill Education