
Operations Research : Applications and Algorithms
4th Edition
ISBN: 9780534380588
Author: Wayne L. Winston
Publisher: Brooks Cole
expand_more
expand_more
format_list_bulleted
Related questions
Question
Answer the question using matlab and show your steps & work
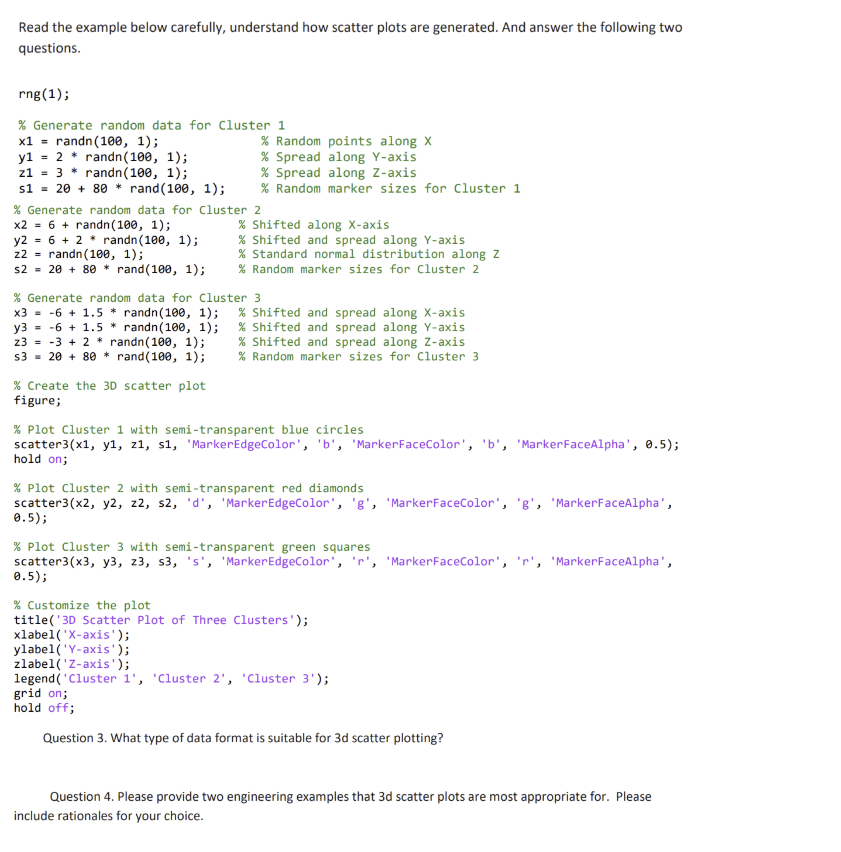

Transcribed Image Text:Read the example below carefully, understand how scatter plots are generated. And answer the following two
questions.
rng(1);
% Generate random data for Cluster 1
x1 = randn (100, 1);
y12randn(100, 1);
z1
3
randn(100, 1);
s1 = 20 + 80 * rand(100, 1);
% Random points along X
% Spread along Y-axis
% Spread along Z-axis
% Random marker sizes for Cluster 1
% Shifted along X-axis
% Generate random data for Cluster 2
x26+randn(100, 1);
y262randn (100, 1);
randn(100, 1);
z2
s2 = 20 + 80 * rand(100, 1);
% Shifted and spread along Y-axis
% Standard normal distribution along Z
% Random marker sizes for Cluster 2
% Generate random data for Cluster 3
x3 -6 + 1.5 * randn(100, 1);
y3-61.5 randn (100, 1);
z3-32
s3 20+80
randn(100, 1);
rand(100, 1);
% Create the 3D scatter plot
figure;
% Shifted and spread along X-axis
% Shifted and spread along Y-axis
% Shifted and spread along Z-axis
% Random marker sizes for Cluster 3
% Plot Cluster 1 with semi-transparent blue circles
scatter3(x1, y1, z1, s1, 'MarkerEdgeColor', 'b', 'MarkerFaceColor', 'b', 'Marker FaceAlpha', 0.5);
hold on;
% Plot Cluster 2 with semi-transparent red diamonds
scatter3(x2, y2, 22, s2, 'd', 'MarkerEdgeColor', 'g', 'MarkerFaceColor', 'g', 'MarkerFaceAlpha',
0.5);
% Plot Cluster 3 with semi-transparent green squares
scatter3(x3, y3, z3, s3, 's', 'MarkerEdgeColor', 'r', 'MarkerFaceColor', 'r', 'MarkerFaceAlpha',
0.5);
% Customize the plot
title('3D Scatter Plot of Three Clusters');
xlabel('X-axis');
ylabel('Y-axis');
zlabel('Z-axis');
legend('Cluster 1', 'Cluster 2', 'Cluster 3');
grid on;
hold off;
Question 3. What type of data format is suitable for 3d scatter plotting?
Question 4. Please provide two engineering examples that 3d scatter plots are most appropriate for. Please
include rationales for your choice.
Expert Solution
This question has been solved!
Explore an expertly crafted, step-by-step solution for a thorough understanding of key concepts.

Step by stepSolved in 2 steps

Knowledge Booster

Similar questions
Recommended textbooks for you
- Operations Research : Applications and AlgorithmsComputer ScienceISBN:9780534380588Author:Wayne L. WinstonPublisher:Brooks Cole

 COMPREHENSIVE MICROSOFT OFFICE 365 EXCEComputer ScienceISBN:9780357392676Author:FREUND, StevenPublisher:CENGAGE L
 - Np Ms Office 365/Excel 2016 I NtermedComputer ScienceISBN:9781337508841Author:CareyPublisher:Cengage
 C++ Programming: From Problem Analysis to Program...Computer ScienceISBN:9781337102087Author:D. S. MalikPublisher:Cengage Learning
 A Guide to SQLComputer ScienceISBN:9781111527273Author:Philip J. PrattPublisher:Course Technology Ptr
Operations Research : Applications and Algorithms
Computer Science
ISBN:9780534380588
Author:Wayne L. Winston
Publisher:Brooks Cole
COMPREHENSIVE MICROSOFT OFFICE 365 EXCE
Computer Science
ISBN:9780357392676
Author:FREUND, Steven
Publisher:CENGAGE L
Np Ms Office 365/Excel 2016 I Ntermed
Computer Science
ISBN:9781337508841
Author:Carey
Publisher:Cengage
C++ Programming: From Problem Analysis to Program...
Computer Science
ISBN:9781337102087
Author:D. S. Malik
Publisher:Cengage Learning
A Guide to SQL
Computer Science
ISBN:9781111527273
Author:Philip J. Pratt
Publisher:Course Technology Ptr