
MATLAB: An Introduction with Applications
6th Edition
ISBN: 9781119256830
Author: Amos Gilat
Publisher: John Wiley & Sons Inc
expand_more
expand_more
format_list_bulleted
Related questions
Question
| 11 | The p-value for the test is, | ||
| a | 0.0277 | ||
| b | 0.0459 | ||
| c | 0.0722 | ||
| d | 0.0982 |
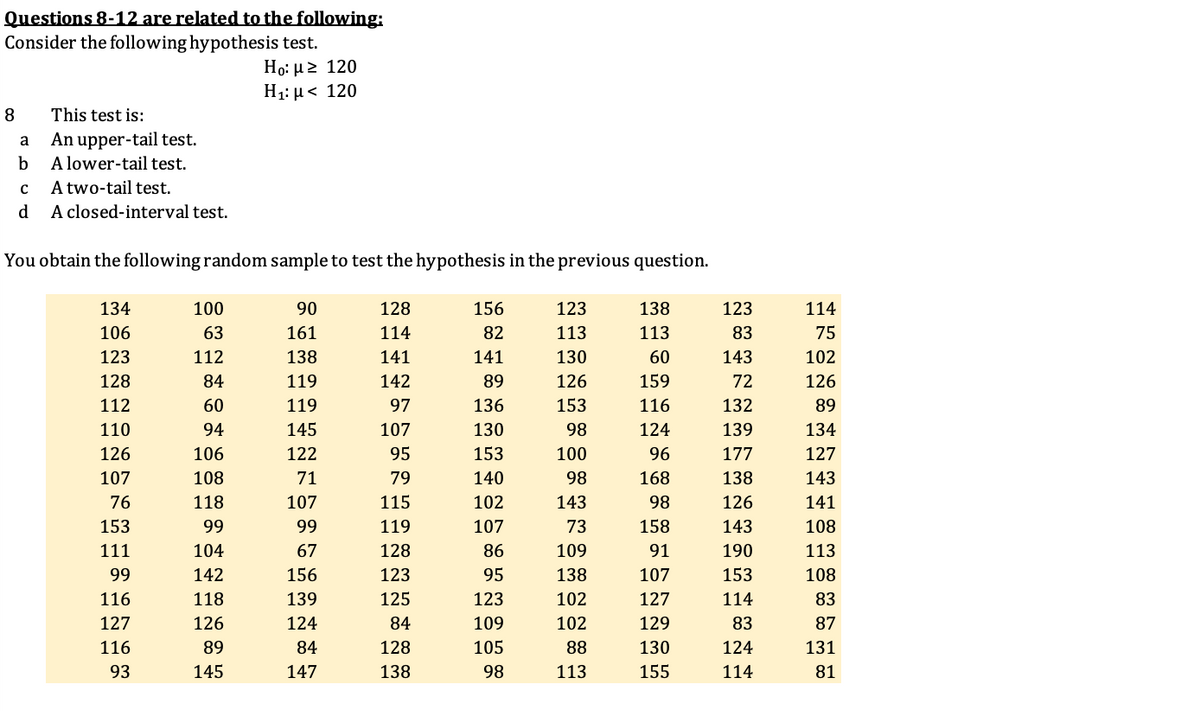

Transcribed Image Text:Questions 8-12 are related to the following:
Consider the following hypothesis test.
Ho: μ 2 120
H1: µ< 120
8
This test is:
An upper-tail test.
A lower-tail test.
a
A two-tail test.
d
A closed-interval test.
You obtain the following random sample to test the hypothesis in the previous question.
134
100
90
128
156
123
138
123
114
106
63
161
114
82
113
113
83
75
123
112
138
141
141
130
60
143
102
128
84
119
142
89
126
159
72
126
112
60
119
97
136
153
116
132
89
110
94
145
107
130
98
124
139
134
126
106
122
95
153
100
96
177
127
107
108
71
79
140
98
168
138
143
76
118
107
115
102
143
98
126
141
153
99
99
119
107
73
158
143
108
111
104
67
128
86
109
91
190
113
99
142
156
123
95
138
107
153
108
116
118
139
125
123
102
127
114
83
127
126
124
84
109
102
129
83
87
116
89
84
128
105
88
130
124
131
93
145
147
138
98
113
155
114
81
Expert Solution
This question has been solved!
Explore an expertly crafted, step-by-step solution for a thorough understanding of key concepts.

Step by stepSolved in 3 steps with 5 images

Knowledge Booster

Similar questions
- phosphorus-32 half life is 14.268 days 1000mg of phosphorus what would the sample size after 14.268 days & 28.536arrow_forwardThe probability of committing a Type I error is: Group of answer choices A.usually equal to the level of measurement B.equal to the standard error always less than the probability of a Type II error C.1.00 minus the probability of committing a Type II error D.the level of significancearrow_forwardGiven P(E or F) = 0.85, P(E) = 0.40, and P(E and F) = 0.09, what is P(F)?arrow_forward
- K Use the results from a survey of a simple random sample of 1278 adults. Among the 1278 respondents, 68% rated 3 of adults rate themselves as above average themselves as above average drivers. We want to test the claim that drivers. Complete parts (a) through (c). 5 869 (Round to the nearest whole number as needed.) b. Identify the sample proportion and use the symbol that represents it. D = 0.68 (Type an integer or a decimal rounded to two decimal places as needed.) c. For the hypothesis test, identify the value used for the population proportion and use the symbol that represents it. (Type an integer or a decimal rounded to two decimal places as needed.)arrow_forwardIm needing help solving the attached imagearrow_forwardUsing r(128) = .34, p > .05, what is sr? a. 0.09 b. 0.18 c. 0.01 d. 0.08arrow_forward
- þoes increasing time spent in the Bible increase overall happiness? A study was performed on Christians who had not been reading the Bible, where 20 subjects were paired based on current happiness levels. Ten subjects spent 30 minutes a day in the Bible, while the other ten spent an hour. After two weeks, overall happiness was recorded. If we want to determine the difference in the two groups, what test statistic would we use? Select one: O a. totest - t(19) O b.x-test x19 c. tp-test - N(0,1) Od tp-test t(18) O e. None of the above O f.tgtest -N(0,1) O g. Zp-test - t(39) O h. t-test -N(0,1) O i. totest - O j.x2-test N(0,1) t(9) ave & Continuearrow_forwardA publisher reports that 61 % of their readers own a particular make of car. A marketing executive wants to test the claim that the percentage is actually different from the reported percentage. A random sample of 320 found that 55 % of the readers owned a particular make of car. Determine the P-value of the test statistic. Round your answer to four decimal places. Answer How to enter your answer (opens in new window) Tables Keypad Keyboard Shortcutsarrow_forwardind the number of successes x suggested by the given statement: From a CNN/USA Today/Gallup poll: Among 1299 survey subjects, 13.7 % say that the opinion of a celebrity would influence their own opinion. x = nothing (round off to a whole number)arrow_forward
arrow_back_ios
arrow_forward_ios
Recommended textbooks for you
- MATLAB: An Introduction with ApplicationsStatisticsISBN:9781119256830Author:Amos GilatPublisher:John Wiley & Sons Inc
 Probability and Statistics for Engineering and th...StatisticsISBN:9781305251809Author:Jay L. DevorePublisher:Cengage Learning
 Statistics for The Behavioral Sciences (MindTap C...StatisticsISBN:9781305504912Author:Frederick J Gravetter, Larry B. WallnauPublisher:Cengage Learning
  Elementary Statistics: Picturing the World (7th E...StatisticsISBN:9780134683416Author:Ron Larson, Betsy FarberPublisher:PEARSON
 The Basic Practice of StatisticsStatisticsISBN:9781319042578Author:David S. Moore, William I. Notz, Michael A. FlignerPublisher:W. H. Freeman
 Introduction to the Practice of StatisticsStatisticsISBN:9781319013387Author:David S. Moore, George P. McCabe, Bruce A. CraigPublisher:W. H. Freeman
MATLAB: An Introduction with Applications
Statistics
ISBN:9781119256830
Author:Amos Gilat
Publisher:John Wiley & Sons Inc
Probability and Statistics for Engineering and th...
Statistics
ISBN:9781305251809
Author:Jay L. Devore
Publisher:Cengage Learning
Statistics for The Behavioral Sciences (MindTap C...
Statistics
ISBN:9781305504912
Author:Frederick J Gravetter, Larry B. Wallnau
Publisher:Cengage Learning
Elementary Statistics: Picturing the World (7th E...
Statistics
ISBN:9780134683416
Author:Ron Larson, Betsy Farber
Publisher:PEARSON
The Basic Practice of Statistics
Statistics
ISBN:9781319042578
Author:David S. Moore, William I. Notz, Michael A. Fligner
Publisher:W. H. Freeman
Introduction to the Practice of Statistics
Statistics
ISBN:9781319013387
Author:David S. Moore, George P. McCabe, Bruce A. Craig
Publisher:W. H. Freeman