
Delmar's Standard Textbook Of Electricity
7th Edition
ISBN: 9781337900348
Author: Stephen L. Herman
Publisher: Cengage Learning
expand_more
expand_more
format_list_bulleted
Related questions
Question

Transcribed Image Text:Questions
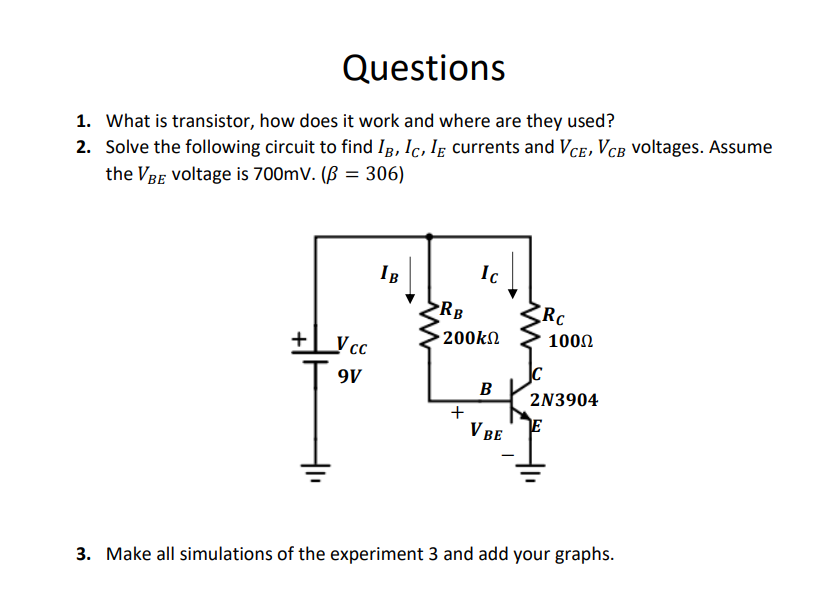
1. What is transistor, how does it work and where are they used?
2. Solve the following circuit to find IB, IC, IE currents and VCE, VCB Voltages. Assume
the VBE voltage is 700mV. (B = 306)
+
VCC
9V
IB
>RB
Ic
· 200ΚΩ
+
B
V BE
Rc
100Ω
2N3904
E
3. Make all simulations of the experiment 3 and add your graphs.
Expert Solution
This question has been solved!
Explore an expertly crafted, step-by-step solution for a thorough understanding of key concepts.

Step by stepSolved in 5 steps

Follow-up Questions
Read through expert solutions to related follow-up questions below.
Follow-up Question
pease fill the table and graphic

Transcribed Image Text:2.1. Aim of Experiment
2.1.1. To extract the transistor parameters.
2.2. Tools and Equipments Required
DMM (Digital Multi Meter)
9 Volt Battery
Resistor (1x100Ω,1x22kΩ, 1x33kΩ, 2x100kΩ, 1x1ΜΩ)
Transistor (1x2N3904)
2.3. Procedure
2.3.1. Obtaining IB, IC and VBE parameters
• Connect the circuit as shown below.
Connect the multimeters to the circuit.
• Apply 9V dc voltage to the circuit.
•
Keep the Rc resistor constant and change RB resistor according to the values provided
in the table.
Measure IB, IC currents and VCE, VBE voltages and write down to the table.
+Vcc
9V
IB
RB
+
Ic
B
V BE
Rc
100Ω
2N3904
E

Transcribed Image Text:S.No
1
2
3
4
5
6
7
(mA)
• Using the values in Table 1, draw the following graphics.
40
35
30
25
20
15
10
5
0
RB
1 ΜΩ
200 kQ
(100k+100k)
100 kQ
50 ΚΩ
(100k//100k)
33 ΚΩ
22 ΚΩ
10 kQ
0
Table 1 Measured values.
IB
Ic
20
40
Calculate the ß using Ic and le values.
IB VS. Ic
60
(μA)
Figure 2
B = ==
Alc
ΔΙΒ
80
100
VCE
120
VBE
140
.
.
c (mA)
40
35
30
25
20
15
10
5
0
0
100
200
300
VBE VS. Ic
400
500
VBE (V)
600
2.3.2. Obtaining IB, IC and VCE parameters
Connect the circuit as shown below.
700
Figure 3
Interpret this graph by comparing it with diode characteristic graph
800
900
Connect the multimeters to the circuit.
Connect the 9V power supply (VBB) to the RB resistor.
Connect the adjustable power supply (Vcc) to the Rc resistor.
Keep the Rc resistor constant and change RB resistor according to the values provided
the table. Also change Vcc adjustable power supply voltage according to the values
provided in the table.
Measure IB, IC currents and VCE voltage and write down to the table.
Solution
by Bartleby Expert
Follow-up Questions
Read through expert solutions to related follow-up questions below.
Follow-up Question
pease fill the table and graphic
Transcribed Image Text:2.1. Aim of Experiment
2.1.1. To extract the transistor parameters.
2.2. Tools and Equipments Required
DMM (Digital Multi Meter)
9 Volt Battery
Resistor (1x100Ω,1x22kΩ, 1x33kΩ, 2x100kΩ, 1x1ΜΩ)
Transistor (1x2N3904)
2.3. Procedure
2.3.1. Obtaining IB, IC and VBE parameters
• Connect the circuit as shown below.
Connect the multimeters to the circuit.
• Apply 9V dc voltage to the circuit.
•
Keep the Rc resistor constant and change RB resistor according to the values provided
in the table.
Measure IB, IC currents and VCE, VBE voltages and write down to the table.
+Vcc
9V
IB
RB
+
Ic
B
V BE
Rc
100Ω
2N3904
E
Transcribed Image Text:S.No
1
2
3
4
5
6
7
(mA)
• Using the values in Table 1, draw the following graphics.
40
35
30
25
20
15
10
5
0
RB
1 ΜΩ
200 kQ
(100k+100k)
100 kQ
50 ΚΩ
(100k//100k)
33 ΚΩ
22 ΚΩ
10 kQ
0
Table 1 Measured values.
IB
Ic
20
40
Calculate the ß using Ic and le values.
IB VS. Ic
60
(μA)
Figure 2
B = ==
Alc
ΔΙΒ
80
100
VCE
120
VBE
140
.
.
c (mA)
40
35
30
25
20
15
10
5
0
0
100
200
300
VBE VS. Ic
400
500
VBE (V)
600
2.3.2. Obtaining IB, IC and VCE parameters
Connect the circuit as shown below.
700
Figure 3
Interpret this graph by comparing it with diode characteristic graph
800
900
Connect the multimeters to the circuit.
Connect the 9V power supply (VBB) to the RB resistor.
Connect the adjustable power supply (Vcc) to the Rc resistor.
Keep the Rc resistor constant and change RB resistor according to the values provided
the table. Also change Vcc adjustable power supply voltage according to the values
provided in the table.
Measure IB, IC currents and VCE voltage and write down to the table.
Solution
by Bartleby Expert
Knowledge Booster


Learn more about
Need a deep-dive on the concept behind this application? Look no further. Learn more about this topic, electrical-engineering and related others by exploring similar questions and additional content below.Similar questions
- Except for FinFET and GaaFET discussed in the lecture, there are many new designs of FET. Please do a detailed study on any of them. In less than 200 words, state the advantages of it over the traditionalarrow_forwardA 2 Volt signal travels from 50 Ohms to 75 Ohms, find the voltage at the interface. If the 2 Voltsignal travels the other way, from 75 Ohms to 50 Ohms. Find the voltage at the interface inboth cases and if it is different explain whyarrow_forwardLet’s look at the Wheatstone bridge where antiparallel diodes are place between nodes A and B. Assume the diodes have the following characteristic:arrow_forward
- I need some help with this problem. I need to create a power supply from 110v 60hz to regulated an output between 6 and 9 v. the image is the desire circuit to acomplish the possible solution. The resistor after the bridge rectifier will work as a surge protector or current limiter for the zener diode. the other is the Load resistor. I need some sort of calculations to prove the specific values for the components to operate according to the specs that I already explain. I know the capacitor will smooth the ripple voltage etc... but I need some guidance to get actual valuesarrow_forwardGiven the circuit design for a Zener diode regulator in the previous question, what is the maximum power that will be dissipated by the Rs resistor? You are told that the source voltage Vs varies from 6 V to 13 V, the load current il varies between 2 mA and 47 mA, and the diode is an ideal 4 V Zener diode. You will need to recalculate the maximum allowable resistance Rs with your new values, as part of this question. Please enter your answer to 3 significant figures, and in Watts.arrow_forward3 A peak rectifier (peak tollower) Cir cuit is gian below. Vs is a GOH3 Sinuscidal Vollge with peak value Upz50V. 50V. The load resistance R= Sk . Find the Vallke of the capacitance C Such that the peak- to-peak ripple 2 volts. (idenl diede) Voltage Vr Vsarrow_forward
- a) Design the network of Figure (1) to maintain VL at 12 V for a load variation IL from (0 mA to 200 mA). Determine Rs, RL and Vz. b) Determine Pzmax for the zener diode. Rs 16 Vo Vz RL Figure (1)arrow_forward7 Item 4: The zener diode shown in the figure has VZ = 20 V. The voltage across the load stays at 20 V as long as IZ is maintained between 400 mA and 2 A. Find the value of series resistance and the load resistance, so that Eo remains 20 V while input voltage Ei is free to vary between 24 V to 30V. O R 24H030.V Vz=20V Rcarrow_forwardConstruct a forward bias diode circuit in multi-sim (desktop, not live). Simulate and find the current through the resistor and the voltage across the resistor.arrow_forward
- Helli. I only need the last part. Plotting power vs voltage if used as a solar cell and give the definition of fill factor. Tnxarrow_forwardQ3. Draw the output voltage waveform for each circuit including the voltage values. (Ideal model) 2.2 k2 +30 V V. OV -30 V +5 V +50 V 47 3.3 kn -5 V -50 V D 2:1 +100 V -- IN4001 R. V ov 10 k2 -100 V IN4001 Q4. For the following bridge rectifier circuit, draw the output voltage waveform across the load (RL) showing the maximum value. Calculate the following: The average value of the output voltage across the load (RL). a. b. The rms value of the output voltage across the load (RL). c. The average load current. d. The rms value of the load current. (Use constant voltage drop model for the Silicon diode) 5:1 D, o Vrms DA 10 KNarrow_forwardIn the circuit shown below, the Zener diode operates at 16 V and its power rating is Pr=3 w. The zener diode needs a minimum of 0.06 A to operate. If V = 60 V, then R can vary between: O a. 223.67 Ohm, 722.33 Ohm: O b.245.67 Ohm, 744.33 Ohm Oc 234.67 Ohm, 733.33 Ohm Od. 257.67 Ohm, 756.33 Ohmarrow_forward
arrow_back_ios
SEE MORE QUESTIONS
arrow_forward_ios
Recommended textbooks for you
- Delmar's Standard Textbook Of ElectricityElectrical EngineeringISBN:9781337900348Author:Stephen L. HermanPublisher:Cengage Learning
Delmar's Standard Textbook Of Electricity
Electrical Engineering
ISBN:9781337900348
Author:Stephen L. Herman
Publisher:Cengage Learning