Advanced Engineering Mathematics
10th Edition
ISBN: 9780470458365
Author: Erwin Kreyszig
Publisher: Wiley, John & Sons, Incorporated
expand_more
expand_more
format_list_bulleted
Question

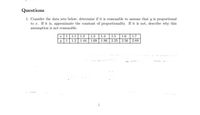
Transcribed Image Text:Questions
1. Consider the data sets below, determine if it is reasonable to assume that y is proportional
to r. If it is, approximate the constant of proportionality. If it is not, describe why this
assumption is not reasonable.
I|1|1.1 | 1.2 | 1.3 | 1.4
y 1 1.2 1.44 1.69 1.96 2.25 2.56 2.89
1.5 1.6 1.7
ate
1
Expert Solution
This question has been solved!
Explore an expertly crafted, step-by-step solution for a thorough understanding of key concepts.
Step by stepSolved in 4 steps

Knowledge Booster
Similar questions
- According to an exit poll for an election, 55.1% of the sample size of 819 reported voting for a specific candidate. Is this enough evidence to predict who won? Test that the population proportion who voted for this candidate was 0.50 against the alternative that it differed from 0.50. Complete parts a through d below. OD. The parameter is the number of voters that voted for the candidate. Define the notation for the parameter. OA. p= the number of voters that did not vote for the candidate OB. p= the number of voters that voted for the candidate C. p=population proportion of voters that voted for the candidate D. p=sample proportion of votes for the candidate b. State the hypotheses and check the assumptions for a large-sample test. Choose the correct answer below. O A. Ho: p=0.50; H₂: p0.50 The assumptions for a large-sample test are met. c. Report the test statistic and P-value and interpret the latter. (Round to two decimal places as needed.) ... D F (1) More xarrow_forwardWhen water flows across farmland, some soil is washed away, resulting in erosion. An experiment was conducted to investigate the effect of the rate of water flow (liters per second) on the amount of soil (kilograms) washed away. The data are given in the following table: Flow rate 0.31 0.85 1.26 2.47 3.75 Eroded soil 0.82 1.95 2.18 3.01 6.07 Let xx represent the flow rate variable and yy represent the variable for soil eroded. Then \bar x = 1.73, s_x = 1.38, \bar y = 2.81, s_y = 1.99xˉ=1.73,sx=1.38,yˉ=2.81,sy=1.99 Use this to complete the following calculation of the correlation coefficient for these data. r = \frac{1}{n-1}\left[\left(\frac{x_1 - \bar x}{s_x}\right)\left(\frac{y_1 - \bar y}{s_y}\right) + \left(\frac{x_2 - \bar x}{s_x}\right)\left(\frac{y_2 - \bar y}{s_y}\right) + \cdots + \left(\frac{x_n - \bar x}{s_x}\right)\left(\frac{y_n - \bar y}{s_y}\right)\right]r=n−11[(sxx1−xˉ)(syy1−yˉ)+(sxx2−xˉ)(syy2−yˉ)+⋯+(sxxn−xˉ)(syyn−yˉ)]…arrow_forwardThe efficiency for a steel specimen immersed in a phosphating tank is the weight of the phosphate coating divided by the metal loss (both in mg/ft?). An article gave the accompanying data on tank temperature (x) and efficiency ratio (y). Temp. 173 175 176 177 177 178 179 180 Ratio 0.94 1.21 1.44 1.05 1.09 1.02 0.96 1.88 Temp. 183 183 183 183 183 184 184 185 Ratio 1.53 1.50 1.57 2.07 2.05 0.86 1.53 0.80 Temp. 185 185 185 187 187 188 189 191 Ratio 1.71 1.96 2.76 1.59 2.60 3.10 1.81 3.18 In USE SALT (a) Determine the equation of the estimated regression line. (Round all numerical values to four decimal places.) (b) Calculate a point estimate for true average efficiency ratio when tank temperature is 185. (Round your answer to four decimal places.) (c) Calculate the values of the residuals from the least squares line for the four observations for which temperature is 185. (Round your answers to two decimal places.) (185, 0.80) (185, 1.71) (185, 1.96) (185, 2.76) Why do they not all have…arrow_forward
- (c) Are your estimates in parts (a) and (b) upper and lower estimates? Ex- plain. (A) (b) is a lower estimate and (a) is an upper estimate since v is a decreasing function of t. (B) (a) is a lower estimate and (b) is an upper estimate since v is an increasing function of t. (C) (a) and (b) are neither lower nor upper estimates since v is neither an increasing nor decreasing function of t. (d) Let's find an overestimate and underestimate of the distance traveled by the motorcycle during this time period.arrow_forwardThe table below shows the relationship between the altitude of the atmosphere and corresponding temperature. Altitude (in feet) 25,000 20,000 15,580 12,902 Temperature (in degree Celsius) 10 16 25 30 What inference can be made from the above data? A.The temperature of the atmosphere decreases with the increase in the altitude. B.The temperature of the atmosphere decreases with the decrease in the altitude. C.The temperature of the atmosphere increases with the increase in the altitude. D.ANo inference can be made from the given data.arrow_forwardI need help finding the distance the stick traveled. It’s average acceleration is 1.5 mph.arrow_forward
arrow_back_ios
arrow_forward_ios
Recommended textbooks for you
 Advanced Engineering MathematicsAdvanced MathISBN:9780470458365Author:Erwin KreyszigPublisher:Wiley, John & Sons, Incorporated
 Numerical Methods for EngineersAdvanced MathISBN:9780073397924Author:Steven C. Chapra Dr., Raymond P. CanalePublisher:McGraw-Hill Education
 Introductory Mathematics for Engineering Applicat...Advanced MathISBN:9781118141809Author:Nathan KlingbeilPublisher:WILEY
 Mathematics For Machine TechnologyAdvanced MathISBN:9781337798310Author:Peterson, John.Publisher:Cengage Learning,


Advanced Engineering Mathematics
Advanced Math
ISBN:9780470458365
Author:Erwin Kreyszig
Publisher:Wiley, John & Sons, Incorporated

Numerical Methods for Engineers
Advanced Math
ISBN:9780073397924
Author:Steven C. Chapra Dr., Raymond P. Canale
Publisher:McGraw-Hill Education

Introductory Mathematics for Engineering Applicat...
Advanced Math
ISBN:9781118141809
Author:Nathan Klingbeil
Publisher:WILEY

Mathematics For Machine Technology
Advanced Math
ISBN:9781337798310
Author:Peterson, John.
Publisher:Cengage Learning,

