
MATLAB: An Introduction with Applications
6th Edition
ISBN: 9781119256830
Author: Amos Gilat
Publisher: John Wiley & Sons Inc
expand_more
expand_more
format_list_bulleted
Related questions
Question
Please help me fast

Transcribed Image Text:Question Help ▼
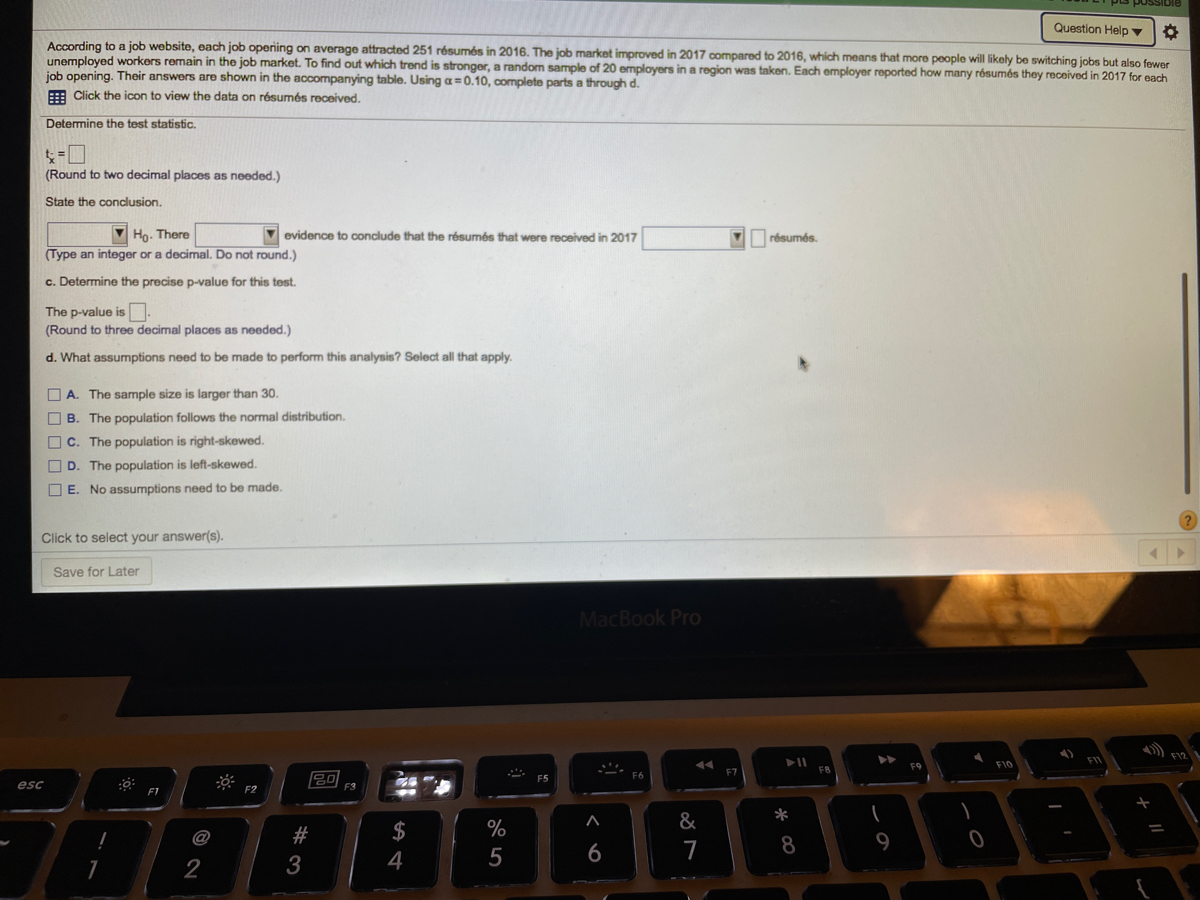
According to a job website, each job opering on average attracted 251 résumés in 2016. The job market improved in 2017 compared to 2016, which means that more people will likely be switching jobs but also fewer
unemployed workers remain in the job market. To find out which trend is stronger, a random sample of 20 employers in a region was taken. Each employer reported how many résumés they received in 2017 for each
job opening. Their answers are shown in the accompanying table. Using a = 0.10, complete parts a through d.
: Click the icon to view the data on résumés received.
Determine the test statistic.
(Round to two decimal places as needed.)
State the conclusion.
Ho. There
(Type an integer or a decimal. Do not round.)
V evidence to conclude that the résumés that were received in 2017
V résumés.
c. Determine the precise p-value for this test.
The p-value is.
(Round to three decimal places as needed.)
d. What assumptions need to be made to perform this analysis? Select all that apply.
O A. The sample size is larger than 30.
O B. The population follows the normal distribution.
O c. The population is right-skewed.
O D. The population is left-skewed.
O E. No assumptions need to be made.
Click to select your answer(s).
Save for Later
MacBook Pro
FII
F9
F10
F7
F8
20
F5
esc
F3
&
*
#
$
%
@
6
7
8
2
3
4

Transcribed Image Text:Question Help ▼
According to a job website, each job opening on average attracted 251 résumés in 2016. The job market improved in 2017 compared to 2016, which means that more people will likely be switching jobs but also fewer
unemployed workers remain in the job market. To find out which trend is stronger, a random sample of 20 employers in a region was taken. Each employer reported how many résumés they received in 2017 for each
job opening. Their answers are shown in the accompanying table. Using a = 0.10, complete parts a through d.
E Click the icon to view the data on résumés received.
a. State the null and altemative hypotheses.
Determine the null hypothesis, Ho, and the alternative hypothesis, H,.
Ho: H
= 251
* 251
H: u
(Type integers or decimals. Do not round.)
b. Does this sample provide enough evidence to suggest that the number of résumés that were received in 2017 has changed?
Identify the critical value.
(Round to two decimal places as needed.)
Determine the test statistic.
(Round to two decimal places as needed.)
State the conclusion.
résumés.
V evidence to conclude that the résumés that were received in 2017
Ho. There
(Type an integer or a decimal. Do not round.)
Click to select your answer(s).
Save for Later
MacBook Pro
ו (R
F10
F7
F8
20
F5
esc
F3
F1
F2
*
%
@
9
%24
Expert Solution
This question has been solved!
Explore an expertly crafted, step-by-step solution for a thorough understanding of key concepts.

This is a popular solution

Trending nowThis is a popular solution!

Step by stepSolved in 2 steps with 2 images

Knowledge Booster


Learn more about
Need a deep-dive on the concept behind this application? Look no further. Learn more about this topic, statistics and related others by exploring similar questions and additional content below.Similar questions
- Two roads intesect each other atr an angel 90 degrees. Cars A and B leave an intersection simultaneosly, one traveling doen a road at 40 mph and another traveiling down at 30mph. How fast is the distance between the cars changing after 3 minutes?arrow_forwardhelp integrate this, please use a piece of paper and don't type please.arrow_forward
Recommended textbooks for you
- MATLAB: An Introduction with ApplicationsStatisticsISBN:9781119256830Author:Amos GilatPublisher:John Wiley & Sons Inc
 Probability and Statistics for Engineering and th...StatisticsISBN:9781305251809Author:Jay L. DevorePublisher:Cengage Learning
 Statistics for The Behavioral Sciences (MindTap C...StatisticsISBN:9781305504912Author:Frederick J Gravetter, Larry B. WallnauPublisher:Cengage Learning
  Elementary Statistics: Picturing the World (7th E...StatisticsISBN:9780134683416Author:Ron Larson, Betsy FarberPublisher:PEARSON
 The Basic Practice of StatisticsStatisticsISBN:9781319042578Author:David S. Moore, William I. Notz, Michael A. FlignerPublisher:W. H. Freeman
 Introduction to the Practice of StatisticsStatisticsISBN:9781319013387Author:David S. Moore, George P. McCabe, Bruce A. CraigPublisher:W. H. Freeman
MATLAB: An Introduction with Applications
Statistics
ISBN:9781119256830
Author:Amos Gilat
Publisher:John Wiley & Sons Inc
Probability and Statistics for Engineering and th...
Statistics
ISBN:9781305251809
Author:Jay L. Devore
Publisher:Cengage Learning
Statistics for The Behavioral Sciences (MindTap C...
Statistics
ISBN:9781305504912
Author:Frederick J Gravetter, Larry B. Wallnau
Publisher:Cengage Learning
Elementary Statistics: Picturing the World (7th E...
Statistics
ISBN:9780134683416
Author:Ron Larson, Betsy Farber
Publisher:PEARSON
The Basic Practice of Statistics
Statistics
ISBN:9781319042578
Author:David S. Moore, William I. Notz, Michael A. Fligner
Publisher:W. H. Freeman
Introduction to the Practice of Statistics
Statistics
ISBN:9781319013387
Author:David S. Moore, George P. McCabe, Bruce A. Craig
Publisher:W. H. Freeman