Question 9: The following table gives data on monthly changes in the spot price and the futures price for a certain commodity. Use the data to calculate a minimum variance hedge ratio.
Q: Stock price variance (that is, riskiness of stock)What is the value of a call option with these…
A: Calculate the value of call as follows: Value of call = (Spot price *N(d1)) - (Strike price*…
Q: ) An analyst wants to evaluate portfolio X, using both the Treynor and Sharpe measures of portfolio…
A: Part (c) has been solved. Portfolio’s M2 is the excess return earned by adjusting the portfolio and…
Q: A futures price is currently 41 and has a volatility of 30%. The risk-free rate is 5%. The strike…
A: Given: Spot price = 41 Volatility = 30% Risk free rate = 5% Period = 9 months Strike price = 40
Q: The market and Stock ) have the following probablity distributions: Probability TH 0.3 14% 19% 0.4…
A: Expected Return = sum of (Probability * Return) Variance = Sum of (Probability *(Return-Mean)^2)…
Q: The return, standard deviation, market risk premium and Beta (β) of A, B, C, D and the Market…
A: The performance of the portfolios can be measured using Sharpe ratio, Treynor ratio and Jensen's…
Q: a. Construct a price-weighted index for these three stocks, and compute the percentage change in the…
A: Price-Weighted Index = Sum of All Prices/Number of Stock Value-weighted Index = Total Value of…
Q: An analyst wants to evaluate Portfolio X, consisting entirely of U.S. common stocks, using both the…
A: The Treynor measure (T) relates the rate of return earned above the risk‑free rate to the…
Q: ou have found the following information: Stock price = $90 Exercise price = $96 Call price = $5 Put…
A: Detailed calculation has been given on the next sheet:
Q: A price-weighted index comprises of 3 stocks A, B, and C. The beginning of year prices of 3 stocks…
A: Since you have provided two different snips with two different questions, it possible to solve to…
Q: ou are given the following information regarding prices for a sample of stocks. a. Construct a…
A: Price-Weighted Index = Sum of All Prices/Number of Stock Value-weighted Index = Total Value of…
Q: Below are the annual returns of the stock A, B, C and D and the market portfolio for the period…
A: Expected return and Standard deviation can be computed as follows:
Q: Characteristic Line and Security Market Line You are given the following set of data: Historical…
A: a) Beta co-efficient of a stock can be calculated using the formula as below:…
Q: Based on the following information, calculate the expected return and standard deviation for each of…
A: Expected return refers to the amount of returns on estimated or probability basis for the future…
Q: Suppose that the index model for stocks A and B is estimated from excess returns with the following…
A: The question is based on the concept of co-variance calculation between stock and market index , in…
Q: Need help on all
A: Hi there, Thanks for posting the question. As per Q&A Guidelines, we should answer the first…
Q: Based on the following information, calculate the expected return and standard deviation for each of…
A: Honor code: Since you have asked multiple questions, we will solve the first question for you. If…
Q: Assume the market portfolio's and risk-free rate's projected returns are 13% and 3%, respectively.…
A: There are various portfolio performance measures and one such measure is Treynors' ratio. This ratio…
Q: 2. (a) Let the following be observed for the stock price of ZPZ-Bank this day: P = £5.50 (The…
A: Here, To Find: Part a. Fair value of three-month call option =? Part b. Fair value of three-month…
Q: Assume the betas for securities A, B, and C are as shown here: °. a. Calculate the change in return…
A: Security's Change in return = Change in Market Return * Beta
Q: equals the slope of the security market line: one. beta. the market risk premium. the expected…
A: Security refers to the financial asset which doesn’t have any real value like golds and other metals…
Q: he following shows the expected percentage returns on three stocks over the next six years: Stock…
A: (i) Calculation of expected return:- year X Y Z 1 10 8 5 2 5 4 10 3 6 4.80 12 4 8 6.4 10…
Q: Below are the annual returns of the stock A, B, C and D and the market portfolio for the period…
A: “Hey, since there are multiple questions posted, we will answer first question. If you want any…
Q: An analyst wants to evaluate Portfolio X, consisting entirely of U.S. common stocks, using both the…
A: Treynor ratio = (Average return - Risk free rate)/Beta Sharpe ratio = (Average return - Risk free…
Q: Using the data in the following table, calculate the volatility (standard deviation) of a portfolio…
A: Given: Weight 75% 25% Year Stock A Stock B 2010 -10% 16% 2011 5% 20% 2012 2% 26% 2013…
Q: estimate the standard deviations of Stocks A and B. Then, compute the expected return, standard…
A: a) Standard deviation of A= (Beta2*Market SD2+Firm-specific SD2)(1/2)…
Q: A challenge we run into when forecasting future stock returns is that stock returns compound. So,…
A:
Q: Using the return data on portfolios A and B provided in the accompanying spreadsheet, compute the…
A: Standard deviation is a measure of Volatility, so, In this question we need to find out Standard…
Q: Question; In considering the purchase of a certain stock, you attach the following probabilities to…
A: Consider, the given table is: X P(X) +15 0.2 +5 0.3 0 0.4 -5 0.04 -15 0.05
Q: average monthly returnn, its return variance, standard deviation and betas
A: Average Monthly Returns: Average monthly returns are the amount which a firm expects to return from…
Q: What is the standard deviation of Stock B returns given the information below about its returns…
A: Standard Deviation: Standard deviation is a measure of the dispersion of a set of data relative to…
Q: Assume that two securities, A and B, constitute the market portfolio, their proportions and…
A: Most of the investors use beta in order to know whether the stock moves in the same direction as the…
Q: Consider a well-diversified portfolio composed of stocks with the same beta and standard deviation…
A: 1. Beta of the portfolio = (0.94 + 0.10 + 1.26)/3 = 0.77 when…
Q: The table below contains records of rates of return for a mutual fund F and for the market portfolio…
A:
Q: We have the following information on Stocks A and B. The risk-free rate is S the market risk premium…
A: Stock is overpriced when the expected return is less than required rate and when stock is…
Q: The correlation between changes in price of a spot asset and futures asset is 69%. The standard…
A: An optimal Hedge Ratio is a minimum variance Hedge Ratio, It is the % of Asset or liability to be…
Q: Data are given as follows: (all the values are in percent) Month Average portfolio return market…
A: Sharpe ratio: It is a measure of the excess return earned to compensate for the volatility of…
Q: An analyst wants to evaluate Portfolio X consisting entirely of US common stocks, using both the…
A: Sharpe and Treynor ratios are calculated by the investors to determine the relationship between the…
Q: Using the data in the chart, calculate the first-period rates of return on the following indexes of…
A: SOLUTION:- t=0 Price( P0 ) (Q0) Market Value(P0 x Q0) A $90 100 $9,000 B $50 200 $10,000 C…
Q: (a) Using a mean-variance framework, compute the optimal hedge ratio of a producer using oil futures…
A: Given:- Spot price = $50 Futures price = $45 Expected futures price = $35 Variance of Futures price…
Q: Suppose that the index model for stocks A and B is estimated from excess returns with the following…
A: We know that, Beta of Stock = correlation*Standard Deviation of Stock/Standard Deviation of Market…
Q: Draw the binomial tree listing only the option prices at each node. Assume the following data on a…
A: Note: We’ll answer the first question since the exact one wasn’t specified. Please submit a new…
I need explain within 300words plz
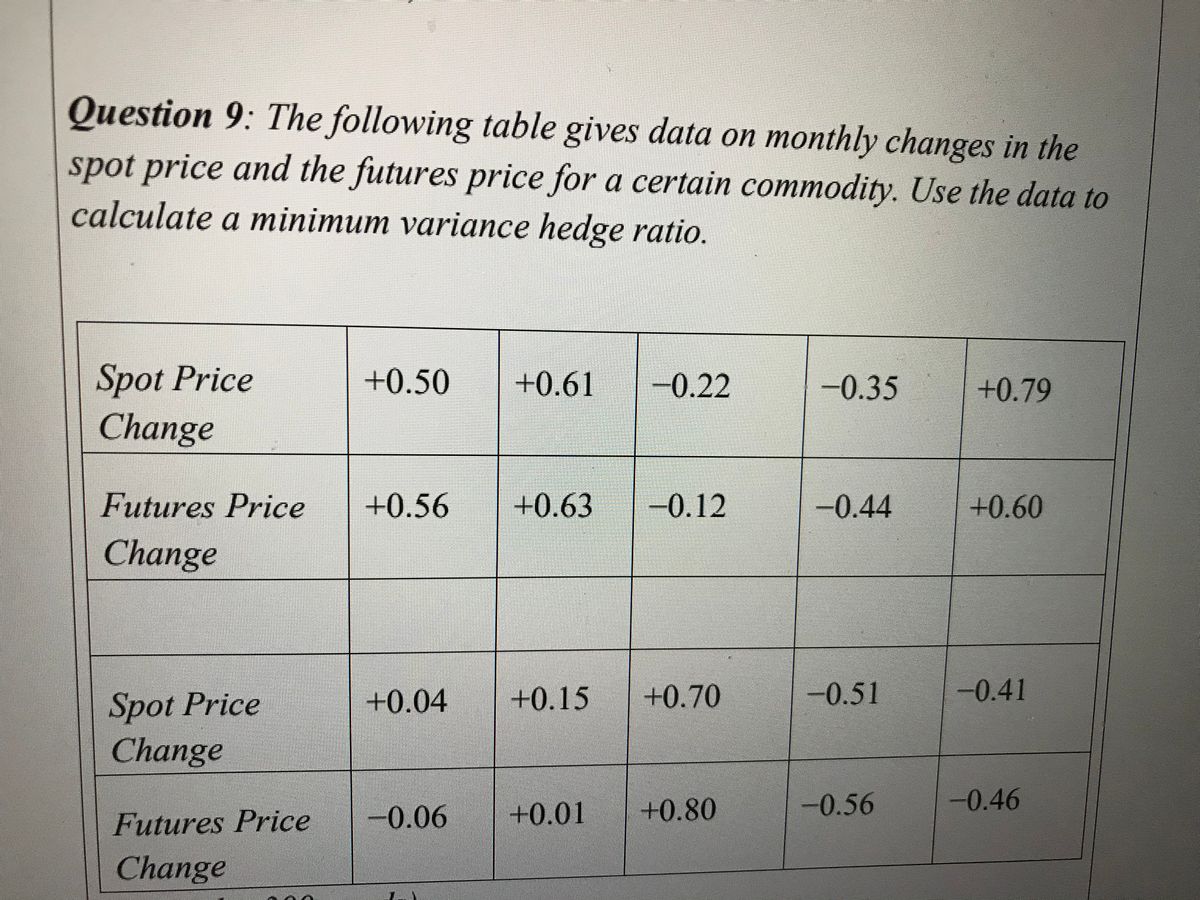
Trending now
This is a popular solution!
Step by step
Solved in 5 steps with 61 images
- Assume that you are given the following partial covariance and correlation matrices for Securities J, K and the Market. Also assume that the expected risk-free rate for the coming year is 3.0 percent and that the expected risk premium on the market is 7.0 percent. Given this information, determine the required rate of return for Security J for the coming year, using CAPM. J Market Correlation J K Market Covariance J K Market Standard Deviation O 18.48% O 20.20% O 15.48% O 12.71% O 15.04% 0.44 0.86 J 0.014400 J K 0.64 K CAN 0.016900 K 1.00 Market 0.003600 MarketQuestion 1 Refer to the following observations for stock A and the market portfolio in the table:Month Stock A Market portfolio1 0.30 0.122 0.24 0.083 -0.04 -0.104 0.10 -0.025 0.06 0.086 0.10 0.07 a) Calculate the main statistic measures to explain the relationship between stock A and the market portfolio:• The sample covariance between rate of return for the stock A and the market;• The sample Beta factor of stock A;• The sample correlation coefficient between the rates of return of the stock A and the marketConsider the following information: Portfolio Expected Return Standard Deviation Risk-free 7% 0% Market 11.6 28 A 10.0 17 Required: a. Calculate the Sharpe ratios for the market portfolio and portfolio A. (Round your answers to 2 decimal places.) b. If the simple CAPM is valid, is the above situation possible?
- The following portfolios are being considered for investment. During the period under consideration, RFR = 0.08. Portfolio Return Beta σi P 0.14 1.00 0.05 Q 0.20 1.30 0.11 R 0.10 0.60 0.03 S 0.17 1.20 0.06 Market 0.12 1.00 0.04 Compute the Sharpe measure for each portfolio and the market portfolio. Round your answers to three decimal places. Portfolio Sharpe measure P Q R S Market Compute the Treynor measure for each portfolio and the market portfolio. Round your answers to three decimal places. Portfolio Treynor measure P Q R S MarketData are given as follows: (all the values are in percent) Month Average portfolio return market Average Average risk-free return rate 2.464 3.360 0.090 16.130 2.348 0.090 0.771 -1.484 0.120 -6.386 -2.437 0.120 15 -2.861 1.965 0.090 16 -7.673 2.806 0.120 0.805 -5.721 0.150 -0.372 0.327 0.150 1.508 2.464 0.150 10 2.003 2.250 0.150 11 -4.723 6.639 0.210 12 Calculate Treynor measure, Sharpe ratio, tracking error, information ratio, and hit ratio. Then, evaluate the performance of this portfolio. 2.383 4.874 0.210Consider the following information for four portfolios, the market, and the risk-free rate (RFR): Portfolio Return Beta SD A1 0.15 1.25 0.182 A2 0.1 0.9 0.223 A3 0.12 1.1 0.138 A4 0.08 0.8 0.125 Market 0.11 1 0.2 RFR 0.03 0 0 Refer to Exhibit 18.6. Calculate the Jensen alpha Measure for each portfolio. a. A1 = 0.014, A2 = -0.002, A3 = 0.002, A4 = -0.02 b. A1 = 0.002, A2 = -0.02, A3 = 0.002, A4 = -0.014 c. A1 = 0.02, A2 = -0.002, A3 = 0.002, A4 = -0.014 d. A1 = 0.03, A2 = -0.002, A3 = 0.02, A4 = -0.14 e. A1 = 0.02, A2 = -0.002, A3 = 0.02, A4 = -0.14
- Forward prices of the form Fo = S,e"" are sometimes referred to as “risk-adjusted expected future spot prices". If a stock's expected annualized log return is a (i.e. E[Sr] Soear, or – In ("5") = a), show that the expected annualized log return over the period So t = 0 → T (i.e. the rate of appreciation in F) on a forward contract with maturity T years written on that stock must be equal to the risk premium a – r, where r is the annualized risk-free rate. Explain the surprising result that an asset that requires zero initialSECURITY MARKET LINE You are given the following historical data on market returns, r, and the returns on Stocks A and B, r, and rp: 8A-2 M' A Year 1 29.00% 29.00% 20.00% 2 15.20 15.20 13.10 (10.00) (10.00) 0.50 4 3.30 3.30 7.15 5 23.00 23.00 17.00 31.70 31.70 21.35The following portfolios are being considered for investment. During the period under consideration, RFR = 0.07. Portfolio Return Beta P 0.15 1.00 0.05 Q 0.09 0.50 0.03 R. 0.21 1.30 0.10 0.18 1.20 0.06 Market 0.12 1.00 0.04 a. Compute the Sharpe measure for each portfolio and the market portfolio. Round your answers to three decimal places. Portfolio Sharpe measure P Q R Market b. Compute the Treynor measure for each portfolio and the market portfolio. Round your answers to three decimal places. Portfolio Treynor measure P Q R Market c. Rank the portfolios using each measure, explaining the cause for any differences you find in the rankings. Portfolio Rank (Sharpe measure) Rank (Treynor measure) P |-Select- v |-Select- v Q -Select- v -Select- V R. -Select- V -Select- v -Select- v -Select- v Market -Select- v -Select- v -Select- v is poorly diversified since it has a high ranking based on the -Select- but a much lower ranking with the -Select-
- If you plot the relationship between portfolio expected return and portfolio beta, what is the slope of the line that results? (Do not round intermediate calculations and enter your answer as a percent rounded to 2 decimal places, e.g., 32.16.) | Slope of the line %You are given the following partial covariance and correlation tables from historical data: Securities J K Market Securities J K Market 1.24 1.11 1.17 1.03 Covariance Matrix K 0.90 J 0.0020480 0.0021600 Also, you have estimated that the market's standard deviation is 4.3 percent. For the coming year, the expected return on the market is 14.0 percent and the risk-free rate is expected to be 4.0 percent. Given this information, determine the beta for Security K for the coming year, assuming CAPM is the correct model for required returns. Correlation Matrix K 0.60 1.00 0.90 1.00 0.60 0.80 Market 0.0020480 0.0021600 Market 0.80 0.90 1.00 Ston sharing Hidel lines WeThe index model for stocks A and B is estimated from excess return with the following results: RA = -0.01 +0.8RM RB = 0.04 + 1.1RM R-squared 4 = 0.15 R-squared B = 0.3 Market-index risk (oM) is 0.2