MATLAB: An Introduction with Applications
6th Edition
ISBN: 9781119256830
Author: Amos Gilat
Publisher: John Wiley & Sons Inc
expand_more
expand_more
format_list_bulleted
Question

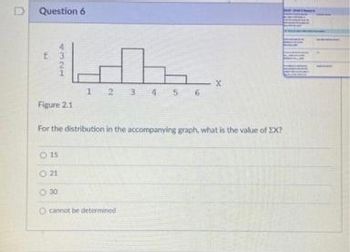
Transcribed Image Text:D
Question 6
f3
1 2 3 4 5 6
X
Figure 2.1
For the distribution in the accompanying graph, what is the value of XX?
0 15
0 21
0 30
O cannot be determined
Expert Solution
This question has been solved!
Explore an expertly crafted, step-by-step solution for a thorough understanding of key concepts.
This is a popular solution
Trending nowThis is a popular solution!
Step by stepSolved in 3 steps with 3 images

Knowledge Booster
Similar questions
- Question 5 The mean height of an adult giraffe is 19 feet. Suppose that the distribution is normally distributed with standard deviation 0.8 feet. Let X be the height of a randomly selected adult giraffe. Round all answers to 4 decimal places where possible. a. What is the distribution of X? X N( b. What is the median giraffe height? ft. c. What is the Z-score for a giraffe that is 22 foot tall? d. What is the probability that a randomly selected giraffe will be shorter than 19.4 feet tall? e. What is the probability that a randomly selected giraffe will be between 18 and 18.8 feet tall? ft. f. The 85th percentile for the height of giraffes is Hint: Helpful videos: • Find a Probability [+] Finding a Value Given a Probability [+] Hint Question Help: Message instructor Submit Questionarrow_forwardQuestions A and B please!arrow_forwardQuestion 1 For the following frequency distribution table calculate the mean, where the class limit is 4 Class upper limit class lower limit 13 6 8 18 20 (Write your answer with Two decimal places, for example 11.17)arrow_forward
- Chapter 5: Uniform Distribution Prog Question 4 The time that it takes for the next train to come follows a Uniform distribution with f(x) =1/45 where x goes between 1 and 46 minutes. Round answers to 4 decimal places when possible. a. This is a Select an answer O distribution. b. It is a Select an answer distribution. C. The mean of this distribution isarrow_forward#16 letter Darrow_forwardComplete the given relative frequency distribution and compute the stated relative frequencies. (a) P({1, 3, 5}) Step 1 Outcome 1 Rel. Frequency 0.1 0.2 (b) P(E) where E = {1, 2, 3} (a) P({1, 3, 5}) 2 Outcome 1 0.1 2 4 We are given the incomplete relative frequency distribution. 3 0.1 5 4 5 Rel. Frequency 0.1 0.2 0.1 0.1 The missing table value is the relative frequency value corresponding to the outcome 0.5 X 5arrow_forward
arrow_back_ios
arrow_forward_ios
Recommended textbooks for you
 MATLAB: An Introduction with ApplicationsStatisticsISBN:9781119256830Author:Amos GilatPublisher:John Wiley & Sons Inc
 Probability and Statistics for Engineering and th...StatisticsISBN:9781305251809Author:Jay L. DevorePublisher:Cengage Learning
 Statistics for The Behavioral Sciences (MindTap C...StatisticsISBN:9781305504912Author:Frederick J Gravetter, Larry B. WallnauPublisher:Cengage Learning
 Elementary Statistics: Picturing the World (7th E...StatisticsISBN:9780134683416Author:Ron Larson, Betsy FarberPublisher:PEARSON
 The Basic Practice of StatisticsStatisticsISBN:9781319042578Author:David S. Moore, William I. Notz, Michael A. FlignerPublisher:W. H. Freeman
 Introduction to the Practice of StatisticsStatisticsISBN:9781319013387Author:David S. Moore, George P. McCabe, Bruce A. CraigPublisher:W. H. Freeman

MATLAB: An Introduction with Applications
Statistics
ISBN:9781119256830
Author:Amos Gilat
Publisher:John Wiley & Sons Inc

Probability and Statistics for Engineering and th...
Statistics
ISBN:9781305251809
Author:Jay L. Devore
Publisher:Cengage Learning

Statistics for The Behavioral Sciences (MindTap C...
Statistics
ISBN:9781305504912
Author:Frederick J Gravetter, Larry B. Wallnau
Publisher:Cengage Learning

Elementary Statistics: Picturing the World (7th E...
Statistics
ISBN:9780134683416
Author:Ron Larson, Betsy Farber
Publisher:PEARSON

The Basic Practice of Statistics
Statistics
ISBN:9781319042578
Author:David S. Moore, William I. Notz, Michael A. Fligner
Publisher:W. H. Freeman

Introduction to the Practice of Statistics
Statistics
ISBN:9781319013387
Author:David S. Moore, George P. McCabe, Bruce A. Craig
Publisher:W. H. Freeman