MATLAB: An Introduction with Applications
6th Edition
ISBN: 9781119256830
Author: Amos Gilat
Publisher: John Wiley & Sons Inc
expand_more
expand_more
format_list_bulleted
Question

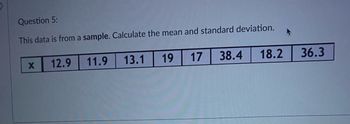
Transcribed Image Text:Question 5:
This data is from a sample. Calculate the mean and standard deviation.
11.9
13.1
17 38.4
X
12.9
19
18.2
36.3
Expert Solution
This question has been solved!
Explore an expertly crafted, step-by-step solution for a thorough understanding of key concepts.
Step by stepSolved in 3 steps

Knowledge Booster
Similar questions
- Listed below are the numbers of hurricanes that occurred in each year in a certain region. The data are listed in order by year. Find the range, variance, and standard deviation for the given sample data. Include appropriate units in the results. What important feature of the data is not revealed by any of the measures of variation? 19 14 9 3 10 15 20 4 10 20 14 6 16 13 The range of the sample data is nothing ▼ years.years. hurricanes squared .hurricanes2. years squared .years2. hurricanes.arrow_forwardThis data is from a sample. Calculate the mean, standard deviation, and variance.arrow_forwardExhibit 11-3 The contents of a sample of 26 cans of apple juice showed a standard deviation of 0.06 ounce. We are interested in testing to determine whether the variance of the population is significantly more than .003. Refer to Exhibit 11-3. The p-value for this test is a) .05 b) greater than .10 c) less than .10 d) 1.96arrow_forward
- If the population standard deviation is 9, then what is the variance? a. 9 b. 81 c. 3 d. 18arrow_forwardDetermine the number of standard deviations from the mean (z-score). In the United States, the distribution of a male's height has a mean of 69 inches with a standard deviation of 3 inches. How many standard deviations from the mean is John Doe, who is 67 inches tall? Question 15 options: 0.67 standard deviations below the mean 0.33 standard deviations below the mean 2 standard deviations below the mean 1 standard deviation below the meanarrow_forwardQuestion 3 The number of hours worked per week for a sample of ten students is shown below. Student Hours 1 39 28 10 16 26 34 38 9. 4 10 32 1. Determine the mean, median, and mode. 2. What is the range of the data for the hours worked? 3. What is the standard deviation for the number of hours worked? 2. 3. 4, 7, 8.arrow_forward
- Can someone help me out with these questions.arrow_forwardQuestion 3 Match the questions with answers. Use this sample data for all questions: Table 2: Time taken in seconds. Sample 290, 340, 150, 300, 200, 100, 400, 500, 600, 89, 94 What is the mean for table 2? A. 278.45 What is the median for table 2? B. no mode v What is the mode for table 2? C. 172.06 v What is the sample standard deviation for table2 ? D. -0.46 Calculate the 75th percentile for table 2. E. 622.58 v What is the interquartile range for table 2? F. 290.00 What is the z score for an x value of 200 using table 2? G. 0.46 v Using the empirical rule to find the range of values containing 95% of the data from table 2, what is the upper value of the range? Hint: use the mean and standard deviation you previously calculated. H. 794.64 I. 177.95 J. 400.00 K. 300.00 L. 198.38 M. 100 N. 370arrow_forwardConsider the following sample data. Sample A: 11, 22, 33 Sample B: 81, 92, 103 Sample C: 1,100; 1,111; 1,122 (a) Find the mean and standard deviation for each sample. Sample A: Sample B: Sample C: Mean Sample Standard Deviation (b) What does this exercise show about the standard deviation? multiple choice The idea is to illustrate that the standard deviation is not a function of the value of the mean. The idea is to illustrate that the standard deviation is a function of the value of the mean.arrow_forward
arrow_back_ios
arrow_forward_ios
Recommended textbooks for you
 MATLAB: An Introduction with ApplicationsStatisticsISBN:9781119256830Author:Amos GilatPublisher:John Wiley & Sons Inc
 Probability and Statistics for Engineering and th...StatisticsISBN:9781305251809Author:Jay L. DevorePublisher:Cengage Learning
 Statistics for The Behavioral Sciences (MindTap C...StatisticsISBN:9781305504912Author:Frederick J Gravetter, Larry B. WallnauPublisher:Cengage Learning
 Elementary Statistics: Picturing the World (7th E...StatisticsISBN:9780134683416Author:Ron Larson, Betsy FarberPublisher:PEARSON
 The Basic Practice of StatisticsStatisticsISBN:9781319042578Author:David S. Moore, William I. Notz, Michael A. FlignerPublisher:W. H. Freeman
 Introduction to the Practice of StatisticsStatisticsISBN:9781319013387Author:David S. Moore, George P. McCabe, Bruce A. CraigPublisher:W. H. Freeman

MATLAB: An Introduction with Applications
Statistics
ISBN:9781119256830
Author:Amos Gilat
Publisher:John Wiley & Sons Inc

Probability and Statistics for Engineering and th...
Statistics
ISBN:9781305251809
Author:Jay L. Devore
Publisher:Cengage Learning

Statistics for The Behavioral Sciences (MindTap C...
Statistics
ISBN:9781305504912
Author:Frederick J Gravetter, Larry B. Wallnau
Publisher:Cengage Learning

Elementary Statistics: Picturing the World (7th E...
Statistics
ISBN:9780134683416
Author:Ron Larson, Betsy Farber
Publisher:PEARSON

The Basic Practice of Statistics
Statistics
ISBN:9781319042578
Author:David S. Moore, William I. Notz, Michael A. Fligner
Publisher:W. H. Freeman

Introduction to the Practice of Statistics
Statistics
ISBN:9781319013387
Author:David S. Moore, George P. McCabe, Bruce A. Craig
Publisher:W. H. Freeman