
MATLAB: An Introduction with Applications
6th Edition
ISBN: 9781119256830
Author: Amos Gilat
Publisher: John Wiley & Sons Inc
expand_more
expand_more
format_list_bulleted
Related questions
Topic Video
Question
Kindly help
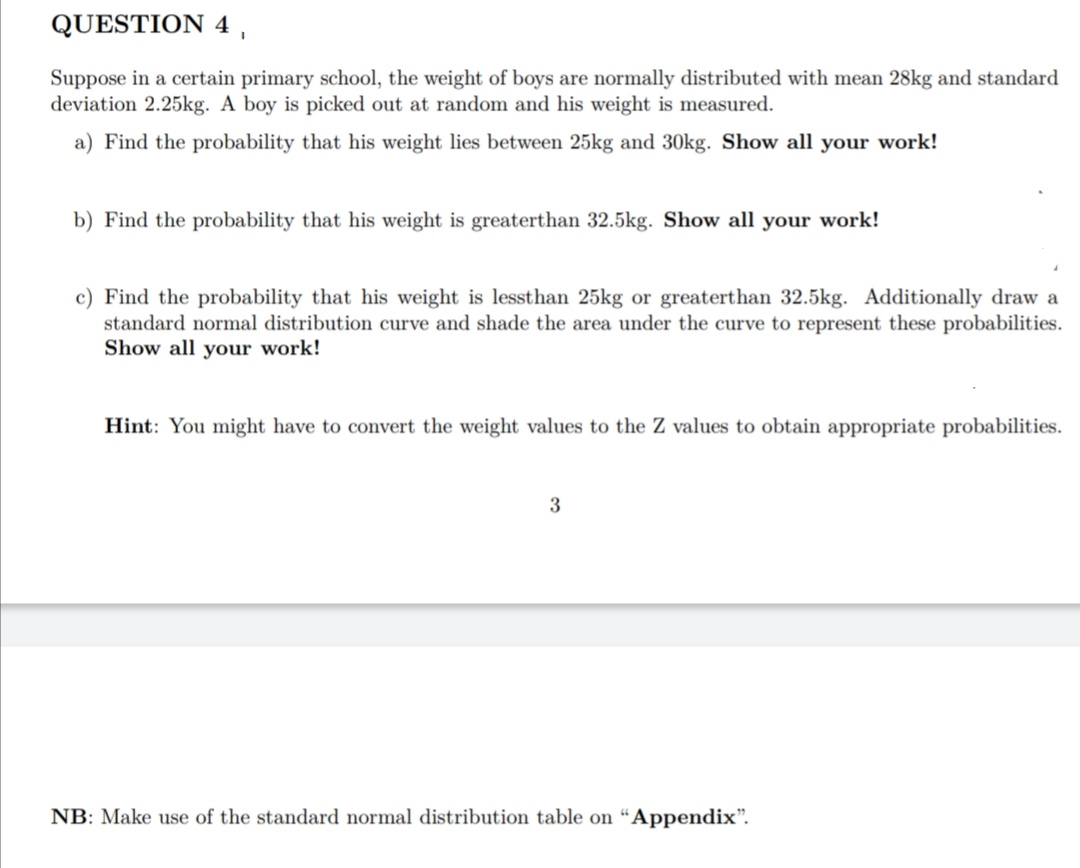

Transcribed Image Text:QUESTION 4,
Suppose in a certain primary school, the weight of boys are normally distributed with mean 28kg and standard
deviation 2.25kg. A boy is picked out at random and his weight is measured.
a) Find the probability that his weight lies between 25kg and 30kg. Show all your work!
b) Find the probability that his weight is greaterthan 32.5kg. Show all your work!
c) Find the probability that his weight is lessthan 25kg or greaterthan 32.5kg. Additionally draw a
standard normal distribution curve and shade the area under the curve to represent these probabilities.
Show all your work!
Hint: You might have to convert the weight values to the Z values to obtain appropriate probabilities.
NB: Make use of the standard normal distribution table on “Appendix".
![Appendix
STANDARD NORMAL DISTRIBUTION: Areas under the standard normal
curve between 0 and z, i.e. Pr[0 < Z < z]
0.00
0.01
0.02
0.03
0.04
0.05
0.06
0.07
0.08
0.09
0.0
0.0000
0.0040
0.0080
0.0120
0.0160
0.0199
0.0239
0.0279
0.0319
0.0359
0.1
0.0398
0.0438
0.0478
0.0517
0.0557
0.0596
0.0636
0.0675
0.0714
0.0753
0.1064
0.1443
0.2
0.0793
0.0832
0.0871
0.0910
0.0948
0.0987
0.1026
0.1103
0.1141
0.3
0.1179
0.1217
0.1255
0.1293
0.1331
0.1368
0.1406
0.1480
0.1517
0.4
0.1554
0.1591
0.1628
0.1664
0.1700
0.1736
0.1772
0.1808
0.1844
0.1879
0.5
0.1915
0.1950
0.1985
0.2019
0.2054
0.2088
0.2123
0.2157
0.2190
0.2224
0.6
0.2257
0.2291
0.2324
0.2357
0.2389
0.2422
0.2454
0.2486
0.2517
0.2549
0.7
0.2580
0.2611
0.2642
0.2673
0.2704
0.2734
0.2764
0.2794
0.2823
0.2852
0.8
0.2881
0.2910
0.2939
0.2967
0.2995
0.3023
0.3051
0.3078
0.3106
0.3133
0.9
0.3159
0.3186
0.3212
0.3238
0.3264
0.3289
0.3315
0.3340
0.3365
0.3389
1.0
0.3413
0.3438
0.3461
0.3485
0.3508
0.3531
0.3554
0.3577
0.3599
0.3621
1.1
0.3643
0.3665
0.3686
0.3708
0.3729
0.3749
0.3770
0.3790
0.3810
0.3830
1.2
0.3849
0.3869
0.3888
0.3907
0.3925
0.3944
0.3962
0.3980
0.3997
0.4015
1.3
0.4032
0.4049
0.4066
0.4082
0.4099
0.4115
0.4131
0.4147
0.4162
0.4177
1.4
0.4192
0.4207
0.4222
0.4236
0.4251
0.4265
0.4279
0.4292
0.4306
0.4319
1.5
0.4332
0.4345
0.4357
0.4370
0.4382
0.4394
0.4406
0.4418
0.4429
0.4441
1.6
0.4452
0.4463
0.4474
0.4484
0.4495
0.4505
0.4515
0.4525
0.4535
0.4545
1.7
0.4554
0.4564
0.4573
0.4582
0.4591
0.4599
0.4608
0.4616
0.4625
0.4633
1.8
0.4641
0.4649
0.4656
0.4664
0.4671
0.4678
0.4686
0.4693
0.4699
0.4706
1.9
0.4713
0.4719
0.4726
0.4732
0.4738
0.4744
0.4750
0.4756
0.4761
0.4767
2.0
0.4772
0.4778
0.4783
0.4788
0.4793
0.4798
0.4803
0.4808
0.4812
0.4817
2.1
0.4821
0.4826
0.4830
0.4834
0.4838
0.4842
0.4846
0.4850
0.4854
0.4857
2.2
0.4861
0.4864
0.4868
0.4871
0.4875
0.4878
0.4881
0.4884
0.4887
0.4890
2.3
0.4893
0.4896
0.4898
0.4901
0.4904
0.4906
0.4909
0.4911
0.4913
0.4916
2.4 0.49180 0.49202 0.49224 0.49245 0.49266 0.49286 0.49305 0.49324 0.49343 0.49361
2.5 0.49379
2.6 0.49534 0.49547 0.49560 0.49573 0.49585 0.49598 0.49609 0.49621 0.49632 0.49643
2.7 0.49653 0.49664 0.49674 0.49683 0.49693 0.49702 0.49711
2.8 0.49744
0.49396 0.49413 0.49430
0.49446
0.49461
0.49477 0.49492 0.49506
0.49520
0.49720 0.49728
0.49736
0.49752 0.49760 0.49767
0.49774 0.49781 0.49788
0.49795 0.49801
0.49807
2.9
0.49813
0.49819
0.49825 0.49831
0.49836
0.49841
0.49846 0.49851
0.49856
0.49861
3.0 0.49865 0.49869 0.49874 0.49878
3.1 0.49903
3.2 0.49931
0.49882
0.49886 0.49889
0.49893 0.49896 0.49900
0.49906
0.49910
0.49913
0.49916
0.49918
0.49921
0.49924
0.49926
0.49929
0.49934 0.49936 0.49938 0.49940 0.49942 0.49944 0.49946 0.49948
0.49950
3.3
0.49952
0.49953 0.49955
0.49957
0.49958
0.49960
0.49961
0.49962 0.49964
0.49965
3.4 0.49966 0.49968 0.49969 0.49970 0.49971 0.49972 0.49973 0.49974 0.49975
3.5 0.49977
3.6 0.49984 0.49985 0.49985 0.49986
0.49976
0.49978
0.49978
0.49979
0.49980
0.49981
0.49981
0.49982
0.49983
0.49983
0.49986 0.49987 0.49987
0.49988 0.49988
0.49989
3.7
0.49989
0.49990 0.49990
0.49990
0.49991
0.49991 0.49992 0.49992 0.49992
0.49992
3.8 0.49993
0.49993 0.49993 0.49994
0.49994 0.49994 0.49994 0.49995 0.49995 0.49995
3.9
0.49995
0.49995 0.49996 0.49996
0.49996
0.49996 0.49996 0.49996 0.49997
0.49997
4.0
0.49997
0.49997 0.49997 0.49997
0.49997 0.49997 0.49998
0.49998
0.49998
0.49998](https://content.bartleby.com/qna-images/question/5eb2cf4a-2e60-4cc6-a01e-d5a0b98f77a8/b006636a-7a67-4773-9dc3-c89bded01a77/m6zptx8_processed.jpeg)
Transcribed Image Text:Appendix
STANDARD NORMAL DISTRIBUTION: Areas under the standard normal
curve between 0 and z, i.e. Pr[0 < Z < z]
0.00
0.01
0.02
0.03
0.04
0.05
0.06
0.07
0.08
0.09
0.0
0.0000
0.0040
0.0080
0.0120
0.0160
0.0199
0.0239
0.0279
0.0319
0.0359
0.1
0.0398
0.0438
0.0478
0.0517
0.0557
0.0596
0.0636
0.0675
0.0714
0.0753
0.1064
0.1443
0.2
0.0793
0.0832
0.0871
0.0910
0.0948
0.0987
0.1026
0.1103
0.1141
0.3
0.1179
0.1217
0.1255
0.1293
0.1331
0.1368
0.1406
0.1480
0.1517
0.4
0.1554
0.1591
0.1628
0.1664
0.1700
0.1736
0.1772
0.1808
0.1844
0.1879
0.5
0.1915
0.1950
0.1985
0.2019
0.2054
0.2088
0.2123
0.2157
0.2190
0.2224
0.6
0.2257
0.2291
0.2324
0.2357
0.2389
0.2422
0.2454
0.2486
0.2517
0.2549
0.7
0.2580
0.2611
0.2642
0.2673
0.2704
0.2734
0.2764
0.2794
0.2823
0.2852
0.8
0.2881
0.2910
0.2939
0.2967
0.2995
0.3023
0.3051
0.3078
0.3106
0.3133
0.9
0.3159
0.3186
0.3212
0.3238
0.3264
0.3289
0.3315
0.3340
0.3365
0.3389
1.0
0.3413
0.3438
0.3461
0.3485
0.3508
0.3531
0.3554
0.3577
0.3599
0.3621
1.1
0.3643
0.3665
0.3686
0.3708
0.3729
0.3749
0.3770
0.3790
0.3810
0.3830
1.2
0.3849
0.3869
0.3888
0.3907
0.3925
0.3944
0.3962
0.3980
0.3997
0.4015
1.3
0.4032
0.4049
0.4066
0.4082
0.4099
0.4115
0.4131
0.4147
0.4162
0.4177
1.4
0.4192
0.4207
0.4222
0.4236
0.4251
0.4265
0.4279
0.4292
0.4306
0.4319
1.5
0.4332
0.4345
0.4357
0.4370
0.4382
0.4394
0.4406
0.4418
0.4429
0.4441
1.6
0.4452
0.4463
0.4474
0.4484
0.4495
0.4505
0.4515
0.4525
0.4535
0.4545
1.7
0.4554
0.4564
0.4573
0.4582
0.4591
0.4599
0.4608
0.4616
0.4625
0.4633
1.8
0.4641
0.4649
0.4656
0.4664
0.4671
0.4678
0.4686
0.4693
0.4699
0.4706
1.9
0.4713
0.4719
0.4726
0.4732
0.4738
0.4744
0.4750
0.4756
0.4761
0.4767
2.0
0.4772
0.4778
0.4783
0.4788
0.4793
0.4798
0.4803
0.4808
0.4812
0.4817
2.1
0.4821
0.4826
0.4830
0.4834
0.4838
0.4842
0.4846
0.4850
0.4854
0.4857
2.2
0.4861
0.4864
0.4868
0.4871
0.4875
0.4878
0.4881
0.4884
0.4887
0.4890
2.3
0.4893
0.4896
0.4898
0.4901
0.4904
0.4906
0.4909
0.4911
0.4913
0.4916
2.4 0.49180 0.49202 0.49224 0.49245 0.49266 0.49286 0.49305 0.49324 0.49343 0.49361
2.5 0.49379
2.6 0.49534 0.49547 0.49560 0.49573 0.49585 0.49598 0.49609 0.49621 0.49632 0.49643
2.7 0.49653 0.49664 0.49674 0.49683 0.49693 0.49702 0.49711
2.8 0.49744
0.49396 0.49413 0.49430
0.49446
0.49461
0.49477 0.49492 0.49506
0.49520
0.49720 0.49728
0.49736
0.49752 0.49760 0.49767
0.49774 0.49781 0.49788
0.49795 0.49801
0.49807
2.9
0.49813
0.49819
0.49825 0.49831
0.49836
0.49841
0.49846 0.49851
0.49856
0.49861
3.0 0.49865 0.49869 0.49874 0.49878
3.1 0.49903
3.2 0.49931
0.49882
0.49886 0.49889
0.49893 0.49896 0.49900
0.49906
0.49910
0.49913
0.49916
0.49918
0.49921
0.49924
0.49926
0.49929
0.49934 0.49936 0.49938 0.49940 0.49942 0.49944 0.49946 0.49948
0.49950
3.3
0.49952
0.49953 0.49955
0.49957
0.49958
0.49960
0.49961
0.49962 0.49964
0.49965
3.4 0.49966 0.49968 0.49969 0.49970 0.49971 0.49972 0.49973 0.49974 0.49975
3.5 0.49977
3.6 0.49984 0.49985 0.49985 0.49986
0.49976
0.49978
0.49978
0.49979
0.49980
0.49981
0.49981
0.49982
0.49983
0.49983
0.49986 0.49987 0.49987
0.49988 0.49988
0.49989
3.7
0.49989
0.49990 0.49990
0.49990
0.49991
0.49991 0.49992 0.49992 0.49992
0.49992
3.8 0.49993
0.49993 0.49993 0.49994
0.49994 0.49994 0.49994 0.49995 0.49995 0.49995
3.9
0.49995
0.49995 0.49996 0.49996
0.49996
0.49996 0.49996 0.49996 0.49997
0.49997
4.0
0.49997
0.49997 0.49997 0.49997
0.49997 0.49997 0.49998
0.49998
0.49998
0.49998
Expert Solution
This question has been solved!
Explore an expertly crafted, step-by-step solution for a thorough understanding of key concepts.

Step by stepSolved in 4 steps with 5 images

Knowledge Booster


Learn more about
Need a deep-dive on the concept behind this application? Look no further. Learn more about this topic, statistics and related others by exploring similar questions and additional content below.Similar questions
Recommended textbooks for you
- MATLAB: An Introduction with ApplicationsStatisticsISBN:9781119256830Author:Amos GilatPublisher:John Wiley & Sons Inc
 Probability and Statistics for Engineering and th...StatisticsISBN:9781305251809Author:Jay L. DevorePublisher:Cengage Learning
 Statistics for The Behavioral Sciences (MindTap C...StatisticsISBN:9781305504912Author:Frederick J Gravetter, Larry B. WallnauPublisher:Cengage Learning
  Elementary Statistics: Picturing the World (7th E...StatisticsISBN:9780134683416Author:Ron Larson, Betsy FarberPublisher:PEARSON
 The Basic Practice of StatisticsStatisticsISBN:9781319042578Author:David S. Moore, William I. Notz, Michael A. FlignerPublisher:W. H. Freeman
 Introduction to the Practice of StatisticsStatisticsISBN:9781319013387Author:David S. Moore, George P. McCabe, Bruce A. CraigPublisher:W. H. Freeman
MATLAB: An Introduction with Applications
Statistics
ISBN:9781119256830
Author:Amos Gilat
Publisher:John Wiley & Sons Inc
Probability and Statistics for Engineering and th...
Statistics
ISBN:9781305251809
Author:Jay L. Devore
Publisher:Cengage Learning
Statistics for The Behavioral Sciences (MindTap C...
Statistics
ISBN:9781305504912
Author:Frederick J Gravetter, Larry B. Wallnau
Publisher:Cengage Learning
Elementary Statistics: Picturing the World (7th E...
Statistics
ISBN:9780134683416
Author:Ron Larson, Betsy Farber
Publisher:PEARSON
The Basic Practice of Statistics
Statistics
ISBN:9781319042578
Author:David S. Moore, William I. Notz, Michael A. Fligner
Publisher:W. H. Freeman
Introduction to the Practice of Statistics
Statistics
ISBN:9781319013387
Author:David S. Moore, George P. McCabe, Bruce A. Craig
Publisher:W. H. Freeman