ENGR.ECONOMIC ANALYSIS
14th Edition
ISBN: 9780190931919
Author: NEWNAN
Publisher: Oxford University Press
expand_more
expand_more
format_list_bulleted
Question

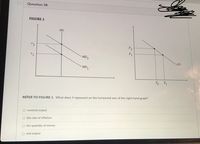
Transcribed Image Text:Question 38
FIGURE 1
MS
r2
P2
P1
MD2
AD
MD,
Y2
REFER TO FIGURE 1. What does Y represent on the horizontal axis of the right-hand graph?
O nominal output
the rate of inflation
O the quantity of money
O real output
Expert Solution
This question has been solved!
Explore an expertly crafted, step-by-step solution for a thorough understanding of key concepts.
Step by stepSolved in 3 steps

Knowledge Booster
Learn more about
Need a deep-dive on the concept behind this application? Look no further. Learn more about this topic, economics and related others by exploring similar questions and additional content below.Similar questions
- Tract 1 123 2 3 4 Group A Group B 25 50 75 100 25 25 25 25 Calculate the dissimilarly index for this county.arrow_forward2. Graphing demand for labor and computing the optimal quantity of labor demanded A company operates in a competitive market, selling each unit of output for a price of $20 and paying the market wage of $330 per day for each worker it hires. In the following table, complete the column for the value of the marginal product of labor (VMPL) at each quantity of workers. Labor Output Marginal Product of Labor Value of the Marginal Product of Labor (Number of workers) (Units of output) (Units of output) (Dollars) 20 1. 20 19 2 39 18 57 15 72 12 84 On the following graph, use the blue points (circle symbol) to plot the firm s labor demand curve. Then, use the orange line (square symbols) to show the wage rate. (Note: If you cannot place the wage rate at the level you want, move the two end points individually.) Hint: Remember to plot each point halfway between the two integers. For example, when the number of workers increases from 0 to 1, the value of the marginal product for the first…arrow_forwardGive an analysis of Elephant Chart by Branko Milanovic.arrow_forward
- FORCASTING using the data below can you answer the question: Month Sales Jan-16 747 Feb-16 697 Mar-16 1014 Apr-16 1126 May-16 1105 Jun-16 1450 Jul-16 1639 Aug-16 1711 Sep-16 1307 Oct-16 1223 Nov-16 975 Dec-16 953 Jan-17 1024 Feb-17 928 Mar-17 1442 Apr-17 1371 May-17 1536 Jun-17 2004 Jul-17 1854 Aug-17 1951 Sep-17 1516 Oct-17 1642 Nov-17 1166 Dec-17 1106 Jan-18 1189 Feb-18 1209 Mar-18 1754 Apr-18 1843 May-18 1769 Jun-18 2207 Jul-18 2471 Aug-18 2288 Sep-18 1867 Oct-18 1980 Nov-18 1418 Dec-18 1333 Jan-19 1333 Feb-19 1370 Mar-19 2142 Apr-19 2138 May-19 2078 Jun-19 2960 Jul-19 2616 Aug-19 2861 Sep-19 2237 Oct-19 2225 Nov-19 1590 Dec-19 1659 Jan-20 1613 Feb-20 1605 Mar-20 2349 Apr-20 2468 May-20 2532 Jun-20 3127 Jul-20 3288 Aug-20 3285 Sep-20 2485 Oct-20 2723 Nov-20 1835 Dec-20 1894 Consider five years of monthly profit for a company Forecast monthly sales for 2022…arrow_forwardCan you draw all of this shifts with grapharrow_forwardThe table below is extracted from HappylandRepublic, Bureau of Statistics records for 2019-2020. Use the information in this table to answer the questions that follow. Items Base year 2019 2020 Production Price Production Price Used cloth (units) 4,000 50.00 5,000 60.00 Components used tractor factory production (units) 8,000 500.00 11,000 1,200.00 Cloth (units) 8,000 25.00 12,000 30.00 Beef gifts during cultural festival (Kg) 1,500 2.00 1,700 3.00 Milk (litres) 5,000 1.30 7,000 2.50 Computers (Units) 2,000 500.00 2,500 600.00 Printers (Units) 500 300.00 400 355.00 Raw materials for car assembling plant (Units) 4,500 250.00 4,450 300.00 1. Calculate HappylandRepublic’s nominal GDP, real GDP in 2020. Also, calculate the GDP deflator if 2019 is used as the base year. 2. Double counting must be avoided when measuring GDP. State and examine…arrow_forward
- The table below is extracted from Happy land Republic, Bureau of Statistics recordsfor 2018-2019. Use the information in this table to answer the questions that follow.Item Base year (2015) 2016Production Price Production PriceUsed car sales 5,000 2000.00 6,000 2,500Factory components sales 8,000 500.00 10,000 1200.00Cloth sales 8,000 20.00 14,000 35.00Beef sales 1,500 10.00 1,800 12.00Milk litres sales 5,000 1.30 6,000 2.50Computers sales 2000 500.00 2500 800.00Printers sales 500 300.00 400 355.00Raw materials for tractorassembling plant sales 4500 250.00 4450 300. i. Calculate Happy Land Republic’s nominal GDP and real GDP in 2016ii. Why does real GDP always defer from nominal GDP?arrow_forwardCalculate the following values for the permutations and combinations. a. P b. På 4 C. Co d. C 3/1 e. C1⁰ 10arrow_forward8arrow_forward
arrow_back_ios
SEE MORE QUESTIONS
arrow_forward_ios
Recommended textbooks for you

 Principles of Economics (12th Edition)EconomicsISBN:9780134078779Author:Karl E. Case, Ray C. Fair, Sharon E. OsterPublisher:PEARSON
 Engineering Economy (17th Edition)EconomicsISBN:9780134870069Author:William G. Sullivan, Elin M. Wicks, C. Patrick KoellingPublisher:PEARSON
 Principles of Economics (MindTap Course List)EconomicsISBN:9781305585126Author:N. Gregory MankiwPublisher:Cengage Learning
 Managerial Economics: A Problem Solving ApproachEconomicsISBN:9781337106665Author:Luke M. Froeb, Brian T. McCann, Michael R. Ward, Mike ShorPublisher:Cengage Learning
 Managerial Economics & Business Strategy (Mcgraw-...EconomicsISBN:9781259290619Author:Michael Baye, Jeff PrincePublisher:McGraw-Hill Education


Principles of Economics (12th Edition)
Economics
ISBN:9780134078779
Author:Karl E. Case, Ray C. Fair, Sharon E. Oster
Publisher:PEARSON

Engineering Economy (17th Edition)
Economics
ISBN:9780134870069
Author:William G. Sullivan, Elin M. Wicks, C. Patrick Koelling
Publisher:PEARSON

Principles of Economics (MindTap Course List)
Economics
ISBN:9781305585126
Author:N. Gregory Mankiw
Publisher:Cengage Learning

Managerial Economics: A Problem Solving Approach
Economics
ISBN:9781337106665
Author:Luke M. Froeb, Brian T. McCann, Michael R. Ward, Mike Shor
Publisher:Cengage Learning

Managerial Economics & Business Strategy (Mcgraw-...
Economics
ISBN:9781259290619
Author:Michael Baye, Jeff Prince
Publisher:McGraw-Hill Education