MATLAB: An Introduction with Applications
6th Edition
ISBN: 9781119256830
Author: Amos Gilat
Publisher: John Wiley & Sons Inc
expand_more
expand_more
format_list_bulleted
Question

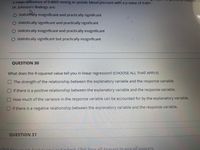
Transcribed Image Text:a mean difference of 0.0005 mmHg in systolic blood pressure with a p value of 0.001.
analyses a
Dr. Johnson's findings are:
O statistically insignificant and practically significant
O statistically significant and practically significant
O statistically insignificant and practically insignificant
O statistically significant but practically insignificant
QUESTION 30
What does the R-squared value tell you in linear regression? (CHOOSE ALL THAT APPLY)
The strength of the relationship between the explanatory variable and the response variable.
If there is a positive relationship between the explanatory variable and the response variable.
How much of the varlance in the response variable can be accounted for by the explanatory variable.
if there is a negative relationship between the explanatory variable and the response variable.
QUESTION 31
spers to saegl.onswers,
Expert Solution
This question has been solved!
Explore an expertly crafted, step-by-step solution for a thorough understanding of key concepts.
Step by stepSolved in 2 steps

Knowledge Booster
Similar questions
- Using a sample of 46 college students, we want to determine if there is a significant correlation between weight (in lbs.) and weekly exercise (in minutes). The results of a correlation and regression analysis are indicated in the Excel output below. The mean weight (the independent variable) was 166.80 lbs., and the mean weekly exercise time (the dependent variable) was 158.83 minutes. SUMMARY OUTPUT Regression Statistics Multiple R 0.027082077 R Square 0.000733439 Adjusted R Square -0.021977165 Standard Error 79.41761298 Observations 46 ANOVA df SS MS F Significance F Regression 1 203.6896 203.6896 0.032295 0.858207 Residual 44 277514.9 6307.157 Total 45 277718.6 Coefficients Standard Error t Stat P-value Lower 95%…arrow_forward19. You might think that increasing the resources available would elevate the number of plant spe- cies that an area could support, but the evidence suggests otherwise. The data in the accompany- ing table are from the Park Grass Experiment at Rothamsted Experimental Station in the U.K., where grassland field plots have been fertilized annually for the past 150 years (collated by Harpole and Tilman 2007). The number of plant species recorded in 10 plots is given in response to the number of different nutrient types added Plot 1 2 3 4 5 6 7 8 9 10 Number of nutrients added 0 0 0 3144 E2 3 Number of plant species 36 36 32 34 33 30 20 23 21 16arrow_forwardWhich statement is not correct for multiple regression model? When we interpret this categorical variable, we would say the change we observe when one switches from the reference category to the specific category. The reference category will not be displayed in our model results. If we include a categorical variable with more than two values (e.g., religion) as an independent variable, we want to include a dummy variable for all categories except for two. We can include more than two categorical variables in the model. The value of the independent variable not included in the model is called "reference category."arrow_forward
- Please answer... I'm needed only 1 hours time to dd .... Thank uarrow_forwardYou plan to fit a regression model that will be used to predict first-year college GPA (FYGPA) from high-school GPA (HSGPA), ACT score (ACT), first-generation status (Yes or No), socioeconomic class (lower class, lower to middle class, middle to upper class, and upper class), and school type (public or private). What is the total number of estimated regression coefficients? If the sample size is n = 250 students, what are the degrees of freedom for the following sources of variation: Regression Error Totalarrow_forward
arrow_back_ios
arrow_forward_ios
Recommended textbooks for you
 MATLAB: An Introduction with ApplicationsStatisticsISBN:9781119256830Author:Amos GilatPublisher:John Wiley & Sons Inc
 Probability and Statistics for Engineering and th...StatisticsISBN:9781305251809Author:Jay L. DevorePublisher:Cengage Learning
 Statistics for The Behavioral Sciences (MindTap C...StatisticsISBN:9781305504912Author:Frederick J Gravetter, Larry B. WallnauPublisher:Cengage Learning
 Elementary Statistics: Picturing the World (7th E...StatisticsISBN:9780134683416Author:Ron Larson, Betsy FarberPublisher:PEARSON
 The Basic Practice of StatisticsStatisticsISBN:9781319042578Author:David S. Moore, William I. Notz, Michael A. FlignerPublisher:W. H. Freeman
 Introduction to the Practice of StatisticsStatisticsISBN:9781319013387Author:David S. Moore, George P. McCabe, Bruce A. CraigPublisher:W. H. Freeman

MATLAB: An Introduction with Applications
Statistics
ISBN:9781119256830
Author:Amos Gilat
Publisher:John Wiley & Sons Inc

Probability and Statistics for Engineering and th...
Statistics
ISBN:9781305251809
Author:Jay L. Devore
Publisher:Cengage Learning

Statistics for The Behavioral Sciences (MindTap C...
Statistics
ISBN:9781305504912
Author:Frederick J Gravetter, Larry B. Wallnau
Publisher:Cengage Learning

Elementary Statistics: Picturing the World (7th E...
Statistics
ISBN:9780134683416
Author:Ron Larson, Betsy Farber
Publisher:PEARSON

The Basic Practice of Statistics
Statistics
ISBN:9781319042578
Author:David S. Moore, William I. Notz, Michael A. Fligner
Publisher:W. H. Freeman

Introduction to the Practice of Statistics
Statistics
ISBN:9781319013387
Author:David S. Moore, George P. McCabe, Bruce A. Craig
Publisher:W. H. Freeman