
MATLAB: An Introduction with Applications
6th Edition
ISBN: 9781119256830
Author: Amos Gilat
Publisher: John Wiley & Sons Inc
expand_more
expand_more
format_list_bulleted
Related questions
Concept explainers
Question
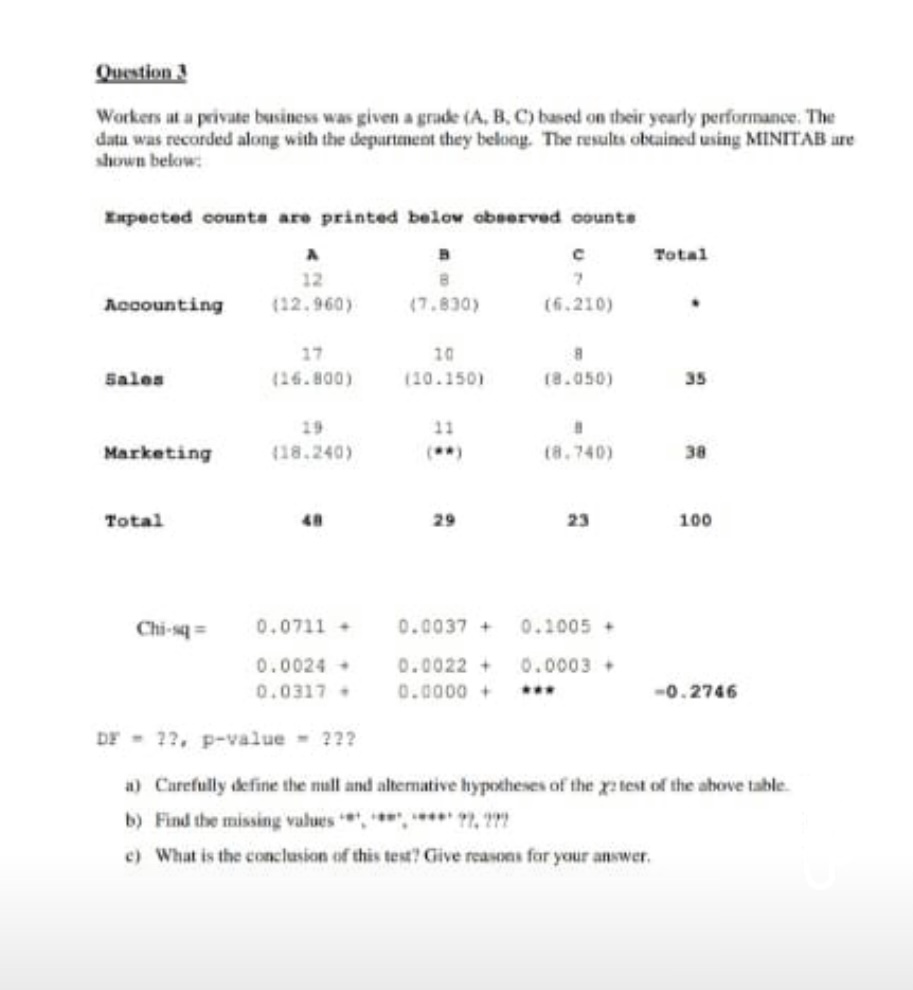

Transcribed Image Text:Question 3
Workers at a private business was given a grade (A, B, C) based on their yearly performance. The
data was recorded along with the depurtment they belong. The results obtained using MINITAB are
shown below:
Expected counta are printed below observed counte
Total
12
Accounting
(12.960)
(7.830)
(6.210)
17
10
Sales
(16.800)
(10.150)
(8.050)
35
19
11
Marketing
(18.240)
(**)
(8.740)
38
Total
48
29
23
100
Chi-sq =
0.0711
0.0037 +
0.1005 +
0.0024 +
0.0022 +
0.0003 +
0.0317
0.0000 +
***
-0.2746
DF - 2?, p-value - 2??
a) Carefully define the mall and altermative hypotheses of the g2 test of the above table.
b) Find the missing values , **,* 1, T
e) What is the conclusion of this test? Give reasons for your answer.
Expert Solution
arrow_forward
Step 1
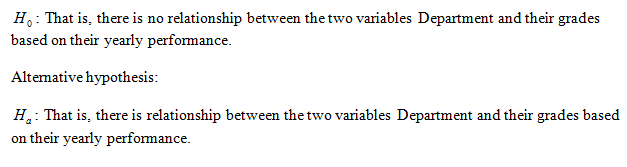
(a)
State the hypotheses.
Null hypothesis:
arrow_forward
Step 2
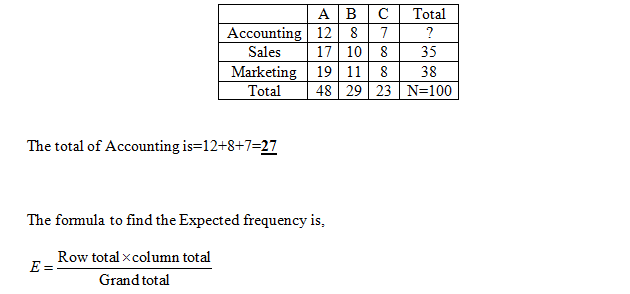
(b)
Obtain the missing values for the given table.
The missing values for the given table is obtained below as follows:
From the information, given that
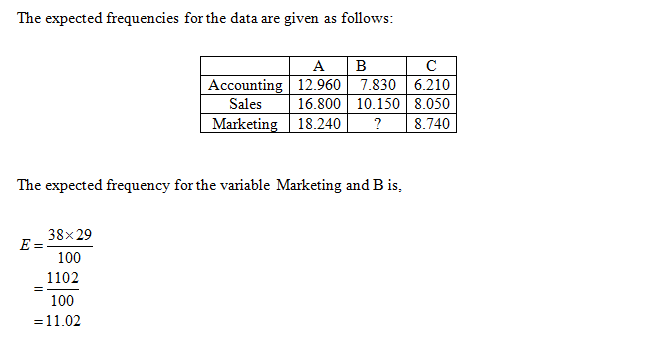
Therefore, the expected frequency for the variable Marketing and B is 11.020.
The chi square contribution for the cell Marketing and C is,
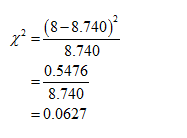
The chi square contribution for the cell Marketing and C is 0.0627

Step by stepSolved in 3 steps with 6 images

Knowledge Booster


Learn more about
Need a deep-dive on the concept behind this application? Look no further. Learn more about this topic, statistics and related others by exploring similar questions and additional content below.Similar questions
- 5. Use the following values to answer the items below: 4, 4, 4, 5, 5, 6, 6, 6, 6, 7, 8, 8, 9, 9, 10, 11 a. Create a simple frequency distribution table. Include columns for frequency, proportion, cumulative frequency, and cumulative percent. b. What is the N? c. What is the mean? d. What is the mode? e. What is the percentile rank of X = 6.5? f. What is the P75 ?arrow_forwardConsider the following data set:[36, 62, 18, 16, 63, 51, 50, 11]Determine the 10th percentile.arrow_forwardFind the 5 number summary for the data shown 5.4 7 9.2 13.8 19.9 21.9 23.3 26.1 5 number summary: Use the Locator/Percentile method described in your book, not your calculator. Submit Question Earrow_forward
- Suppose the value of a stock varies each day from $10.82 to $23.17 with a uniform distribution. Find the third quartile, i.e. , 75% of all days the stock is below what value ?arrow_forwardSurvey was conducted about real estate prices. Data collected is 183237, 273290, 394891, 471556, 505379, 636091, 779283, 895021, 966565, 1012251, 1193014, 1212547, 1359408. What is the 85th percentile price?arrow_forwardThe following are the GPAs of 18 r/s SCC students:1.3, 1.5, 1.7, 2.2, 2.5, 2.6, 2.6, 2.6, 2.6, 2.8, 2.9, 2.9, 3.0, 3.1, 3.5, 3.5, 3.6, 3.9(a) Find the 70th percentile of the data.(b) Find the median and Q1and Q3Make sure you properly justify how to find them.(c)Find all outliers using the IQR method d) Draw the box plot of this dataarrow_forward
- Compute each of the single-variable statistics discussed in class for the data below: 84.7 58.2 89.1 89.7 44.3 91.9 68.3 84.1 94.9 58.2 Find the mean, median, mode, 1st quartile, 3rd quartile, standard deviation, range, variance.arrow_forwardMs. Lorraine Finch, a fifth grade teacher has a large class of 50 students for the 2018 - 2019 school year. After giving a reading comprehension test, Ms. Finch decided to do a brief statistical analysis. A frequency distribution of the results is presented below. a. Fill in the missing pa rts of Ms. Finch’s frequency distribution. Do any necessary scrap work in the space next to the table. b. Construct a histogram of the frequency distribution. c Is the distribution of test scores normal? Explain. Score Frequency Relative Frequency 84 2 0.04 85 5 0.1 86 0.08 87 8 0.16 88 10 89 90 5 0.1 91 4 0.08 92 3 0.06arrow_forwardQ1]. [30%] The data for this question given in the table below come from the sample data folder of MINITAB. The data give you the monthly number of people employed (in units of 1000) in the retail trade industry in the state of Wisconsin from January 1970 to December 1974. Copy this timeseries data into an excel spreadsheet in your home area first before you start your analysis. You can use Excel to answer this question. Month 1970 1971 1972 1973 1974 1 322 322 330 348 361 2 317 318 326 345 354 3 319 320 329 349 357 4 323 326 337 355 367 5 327 332 345 362 376 6 328 334 350 367 381 7 325 335 351 366 381 8 326 336 354 370 383 9 330 335 355 371 384 10 334 338 357 375 387 11 337 342 362 380 392 12 341 348 368 385 396 (a) (b) (c) (d) Draw a time series plot of the data and comment on any noticeable patterns. Describe an appropriate time series model for this data, giving your reasons, and obtain estimates of the components of your model using the decomposition method. Using your model…arrow_forward
arrow_back_ios
arrow_forward_ios
Recommended textbooks for you
- MATLAB: An Introduction with ApplicationsStatisticsISBN:9781119256830Author:Amos GilatPublisher:John Wiley & Sons Inc
 Probability and Statistics for Engineering and th...StatisticsISBN:9781305251809Author:Jay L. DevorePublisher:Cengage Learning
 Statistics for The Behavioral Sciences (MindTap C...StatisticsISBN:9781305504912Author:Frederick J Gravetter, Larry B. WallnauPublisher:Cengage Learning
  Elementary Statistics: Picturing the World (7th E...StatisticsISBN:9780134683416Author:Ron Larson, Betsy FarberPublisher:PEARSON
 The Basic Practice of StatisticsStatisticsISBN:9781319042578Author:David S. Moore, William I. Notz, Michael A. FlignerPublisher:W. H. Freeman
 Introduction to the Practice of StatisticsStatisticsISBN:9781319013387Author:David S. Moore, George P. McCabe, Bruce A. CraigPublisher:W. H. Freeman
MATLAB: An Introduction with Applications
Statistics
ISBN:9781119256830
Author:Amos Gilat
Publisher:John Wiley & Sons Inc
Probability and Statistics for Engineering and th...
Statistics
ISBN:9781305251809
Author:Jay L. Devore
Publisher:Cengage Learning
Statistics for The Behavioral Sciences (MindTap C...
Statistics
ISBN:9781305504912
Author:Frederick J Gravetter, Larry B. Wallnau
Publisher:Cengage Learning
Elementary Statistics: Picturing the World (7th E...
Statistics
ISBN:9780134683416
Author:Ron Larson, Betsy Farber
Publisher:PEARSON
The Basic Practice of Statistics
Statistics
ISBN:9781319042578
Author:David S. Moore, William I. Notz, Michael A. Fligner
Publisher:W. H. Freeman
Introduction to the Practice of Statistics
Statistics
ISBN:9781319013387
Author:David S. Moore, George P. McCabe, Bruce A. Craig
Publisher:W. H. Freeman