
MATLAB: An Introduction with Applications
6th Edition
ISBN: 9781119256830
Author: Amos Gilat
Publisher: John Wiley & Sons Inc
expand_more
expand_more
format_list_bulleted
Related questions
Question
Plz answer asap if I get it wrong it starts me over

Transcribed Image Text:b
lock
Question 3 of 3, Step 5 of 6
^
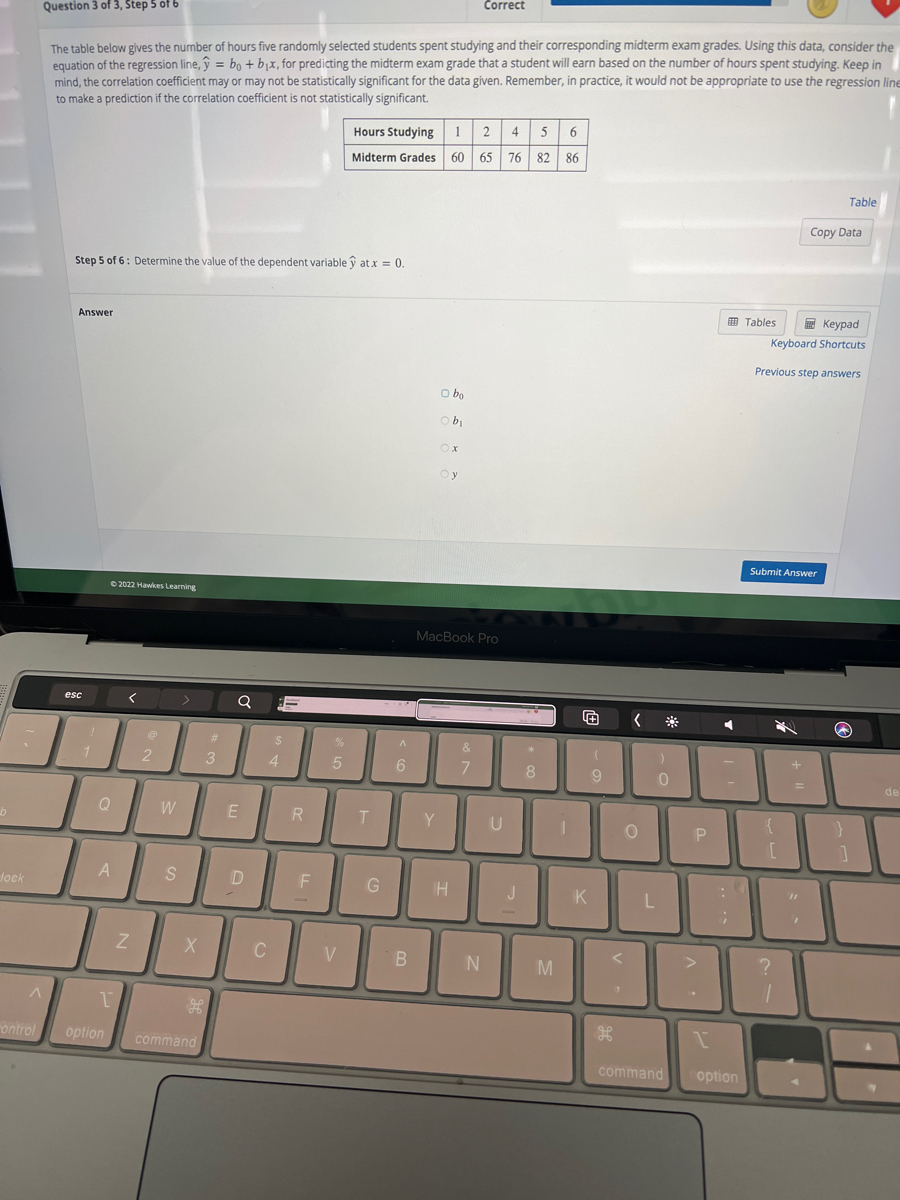
The table below gives the number of hours five randomly selected students spent studying and their corresponding midterm exam grades. Using this data, consider the
equation of the regression line, y = bo + b₁x, for predicting the midterm exam grade that a student will earn based on the number of hours spent studying. Keep in
mind, the correlation coefficient may or may not be statistically significant for the data given. Remember, in practice, it would not be appropriate to use the regression line
to make a prediction if the correlation coefficient is not statistically significant.
Step 5 of 6: Determine the value of the dependent variable y at x = 0.
Answer
esc
1
1
©2022 Hawkes Learning
Q
A
1
ontrol option
<
Z
@
2
W
S
X
H
command
#
3
Q
E
D
C
S
4
-
R
F
%
5
V
Hours Studying 1 2
Midterm Grades 60 65
T
G
6
B
obo
obi
Y
oy
MacBook Pro
Correct
H
&
7
N
U
4 5 6
76 82
86
J
*
8
M
1
K
(
9
H
>
<
O
L
)
0
P
◄
;
I
command option
Tables
Keypad
Keyboard Shortcuts
Previous step answers
Submit Answer
{
[
?
1
=
Copy Data
11
Table
a
}
1
de
Expert Solution
This question has been solved!
Explore an expertly crafted, step-by-step solution for a thorough understanding of key concepts.

This is a popular solution

Trending nowThis is a popular solution!

Step by stepSolved in 2 steps

Knowledge Booster

Similar questions
Recommended textbooks for you
- MATLAB: An Introduction with ApplicationsStatisticsISBN:9781119256830Author:Amos GilatPublisher:John Wiley & Sons Inc
 Probability and Statistics for Engineering and th...StatisticsISBN:9781305251809Author:Jay L. DevorePublisher:Cengage Learning
 Statistics for The Behavioral Sciences (MindTap C...StatisticsISBN:9781305504912Author:Frederick J Gravetter, Larry B. WallnauPublisher:Cengage Learning
  Elementary Statistics: Picturing the World (7th E...StatisticsISBN:9780134683416Author:Ron Larson, Betsy FarberPublisher:PEARSON
 The Basic Practice of StatisticsStatisticsISBN:9781319042578Author:David S. Moore, William I. Notz, Michael A. FlignerPublisher:W. H. Freeman
 Introduction to the Practice of StatisticsStatisticsISBN:9781319013387Author:David S. Moore, George P. McCabe, Bruce A. CraigPublisher:W. H. Freeman
MATLAB: An Introduction with Applications
Statistics
ISBN:9781119256830
Author:Amos Gilat
Publisher:John Wiley & Sons Inc
Probability and Statistics for Engineering and th...
Statistics
ISBN:9781305251809
Author:Jay L. Devore
Publisher:Cengage Learning
Statistics for The Behavioral Sciences (MindTap C...
Statistics
ISBN:9781305504912
Author:Frederick J Gravetter, Larry B. Wallnau
Publisher:Cengage Learning
Elementary Statistics: Picturing the World (7th E...
Statistics
ISBN:9780134683416
Author:Ron Larson, Betsy Farber
Publisher:PEARSON
The Basic Practice of Statistics
Statistics
ISBN:9781319042578
Author:David S. Moore, William I. Notz, Michael A. Fligner
Publisher:W. H. Freeman
Introduction to the Practice of Statistics
Statistics
ISBN:9781319013387
Author:David S. Moore, George P. McCabe, Bruce A. Craig
Publisher:W. H. Freeman