FINANCIAL ACCOUNTING
10th Edition
ISBN: 9781259964947
Author: Libby
Publisher: MCG
expand_more
expand_more
format_list_bulleted
Question

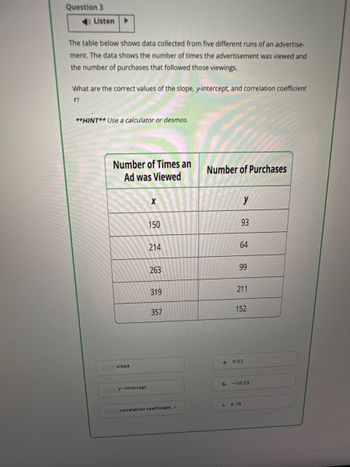
Transcribed Image Text:Question 3
Listen ▸
The table below shows data collected from five different runs of an advertise-
ment. The data shows the number of times the advertisement was viewed and
the number of purchases that followed those viewings.
What are the correct values of the slope, y-intercept, and correlation coefficient
??
**HINT** Use a calculator or desmos.
Number of Times an
Number of Purchases
Ad was Viewed
slope
y-intercept
x
y
150
93
214
64
263
99
319
211
357
152
a.
0.51
b. -10.23
correlation coefficient, r
c. 0.73
Expert Solution
This question has been solved!
Explore an expertly crafted, step-by-step solution for a thorough understanding of key concepts.
Step by stepSolved in 2 steps with 1 images

Knowledge Booster
Similar questions
- Please do not give solution in image format thankuarrow_forwardQuestion 55: A purchases budget estimates merchandise purchases given current inventory and expected demand over the coming period. Answer: A. TrueB. False Question 54: Match each sparkline feature with its best description. Win-loss format Adjacent to associated data Automatic updating Indicates positive or negative data points Where the sparklines are placed Causes sparklines to change when associated data is alteredarrow_forwardThe BEST matching pattern for #6 on Trend Graph (C) is: 1.Rectangle 2.Flag 3.Symmetrical Triangle 4.Cup and Handlearrow_forward
- Analyze Apple Inc. by segment Segment disclosure by Apple Inc. (AAPL) provides sales information for its major product lines for three recent years as follows (in millions): Segment Year 3 Year 2 Year 1 iPhone $136,700 $155,041 $101,991 iPad 20,628 23,227 30,283 25,471 Мас 22,831 24,079 Services 18,063 24,348 19,909 Other Products 11,132 8,379 10,067 $215,639 $233,715 $182,795 Total sales The Services segment includes sales from iTunes Store, App Store, Mac App Store, TV App Store, iBooks Store, Apple Music, AppleCare, and Apple Pay. The Other Products segment includes sales from Apple TV, Apple Watch, Beats products, iPod, and Apple-branded accessories. a. Prepare a vertical analysis of Year 3 sales. (Round percentages to nearest whole percent.) Year 3 Sales Percent of Total Sales Segment iPhone $136,700 % iPad 20,628 % Мас 22,831 Services 24,348 Other Products 11,132 % $215,639 Total sales %arrow_forwardP/S ratio f Data table (Click on the icon here in order to copy the contents of the data table below into a spreadsheet.) Company Facebook Snap Twitter P/S Multiples 13.62 18.41 13.52arrow_forwardPlease don't give image formatarrow_forward
- Question 19arrow_forwardPlease do not give solution in image formatarrow_forward* 00 T 4. File Edit View History Bookmarks Window Help A ezto.mheducation.com Bb Welcome, Aury - Blackb... Close reading assignmen... t Center FEnglish essay - Google D... M MyOpenMath - Gradebook M Question 4 - Chapter 5-.. chapter 5 i Saved Help Save Lopez Company reported the following current-year data for its only product. The company uses a periodic inventory system, and its ending inventory consists of 480 units-160 from each of the last three purchases. 1 Beginning inventory 260 units @ $4.40 = $ 1,144 2,940 5,880 5,616 3,640 $ 19,220 Jan. Mar. 7 Purchase oints 560 units @ $5.25 1,200 units @ $4.90 = 1,080 units @ $5.20 = 560 units @ $6.50 = %3D July 28 Purchase Oct. 3 Purchase Skipped %3D Dec. 19 Purchase %3D Totals 3,660 units eBook Hint Determine the cost assigned to ending inventory and to cost of goods sold for the following. (Do not round intermediate calculations and round your answers to 2 decimal places.) Print References Ending Inventory Cost of Goods Sold (a)…arrow_forward
- Please do not give solution in image format thankuarrow_forwardA supermarket manager has asked you to help assess different shelf locations. To identify which location has the best sales H0: average sales FRONT= average sales MIDDLE = average sales REAR H1: at least one of the average sales differs Your analysis is shown in the following SPSS output: ANOVA Sales Sum of Squares df Mean Square F Sig. Between Groups 48.444 2 24.222 14.105 .000 Within Groups 25.760 15 1.717 Total 74.204 17 Multiple Comparisons Dependent Variable: sales in $1000 Bonferroni (I) shelf space location 1=front; 2=middle; 3= rear (J) shelf space location 1=front; 2=middle; 3= rear Mean Difference (I-J) Std. Error Sig. 95% Confidence Interval Lower Bound Upper Bound 1 2 4000.000* 756.601 .000 1961.92 6038.08 3 2333.333* 756.601 .023 295.25 4371.42 2 1 -4000.000* 756.601 .000 -6038.08 -1961.92 3 -1666.667…arrow_forwardHello can you please explain this step by step pleasearrow_forward
arrow_back_ios
arrow_forward_ios
Recommended textbooks for you

 AccountingAccountingISBN:9781337272094Author:WARREN, Carl S., Reeve, James M., Duchac, Jonathan E.Publisher:Cengage Learning,
 Accounting Information SystemsAccountingISBN:9781337619202Author:Hall, James A.Publisher:Cengage Learning,
 Horngren's Cost Accounting: A Managerial Emphasis...AccountingISBN:9780134475585Author:Srikant M. Datar, Madhav V. RajanPublisher:PEARSON
 Intermediate AccountingAccountingISBN:9781259722660Author:J. David Spiceland, Mark W. Nelson, Wayne M ThomasPublisher:McGraw-Hill Education
 Financial and Managerial AccountingAccountingISBN:9781259726705Author:John J Wild, Ken W. Shaw, Barbara Chiappetta Fundamental Accounting PrinciplesPublisher:McGraw-Hill Education


Accounting
Accounting
ISBN:9781337272094
Author:WARREN, Carl S., Reeve, James M., Duchac, Jonathan E.
Publisher:Cengage Learning,

Accounting Information Systems
Accounting
ISBN:9781337619202
Author:Hall, James A.
Publisher:Cengage Learning,

Horngren's Cost Accounting: A Managerial Emphasis...
Accounting
ISBN:9780134475585
Author:Srikant M. Datar, Madhav V. Rajan
Publisher:PEARSON

Intermediate Accounting
Accounting
ISBN:9781259722660
Author:J. David Spiceland, Mark W. Nelson, Wayne M Thomas
Publisher:McGraw-Hill Education

Financial and Managerial Accounting
Accounting
ISBN:9781259726705
Author:John J Wild, Ken W. Shaw, Barbara Chiappetta Fundamental Accounting Principles
Publisher:McGraw-Hill Education