
MATLAB: An Introduction with Applications
6th Edition
ISBN: 9781119256830
Author: Amos Gilat
Publisher: John Wiley & Sons Inc
expand_more
expand_more
format_list_bulleted
Related questions
Concept explainers
Question

Transcribed Image Text:QUESTION 24
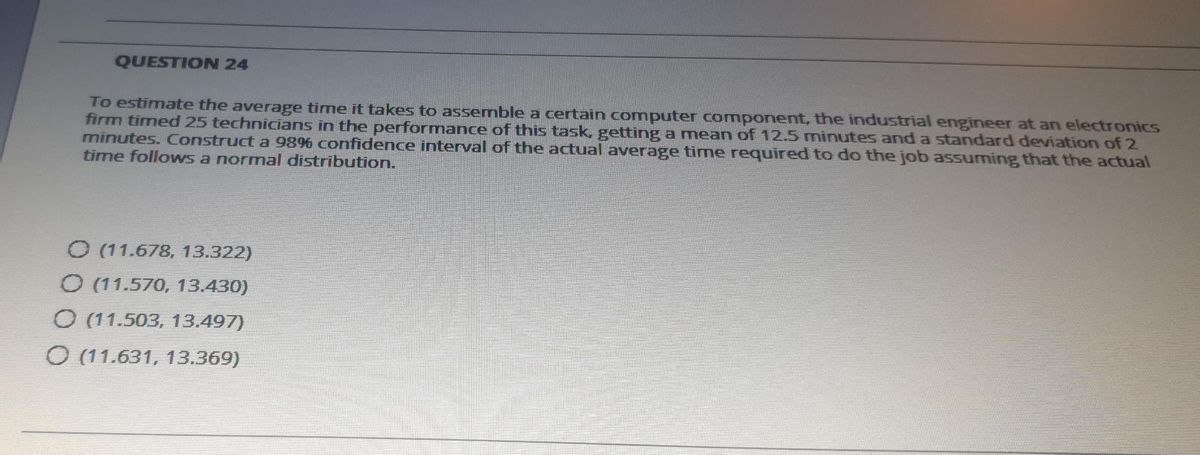
To estimate the average time it takes to assemble a certain conmputer component, the industrial engineer at an electronics
firm timed 25 technicians in the performance of this task, getting a mean of 12.5 minutes anda standard deviation of 2
minutes. Construct a 986 confidence interval of the actual average time required to do the job assuming that the actual
time follows a normal distribution.
O (11.678, 13.322)
O (11.570, 13.430)
O (11.503, 13.497)
O (11.631, 13.369)
Expert Solution
This question has been solved!
Explore an expertly crafted, step-by-step solution for a thorough understanding of key concepts.

Step by stepSolved in 2 steps with 1 images

Knowledge Booster


Learn more about
Need a deep-dive on the concept behind this application? Look no further. Learn more about this topic, statistics and related others by exploring similar questions and additional content below.Similar questions
- Suppose that for the past several decades, daily precipitation in Seattle, Washington has had a mean of 2.4 mm and a standard deviation of 11.4 mm. Researchers suspect that in recent years, the mean amount of daily precipitation has changed, so they plan to obtain data for a random sample of 195 days over the past five years and use this data to conduct a one-sample ?z‑test of ?0:?=2.4H0:μ=2.4 mm against ?1:?≠2.4H1:μ≠2.4 mm, where ?μ is the mean daily precipitation for the last five years. Although they realize that rainfall does not follow a normal distribution, they feel safe using a ?z‑test because the sample size is large. The researchers want to know what the power of this test is to reject the null hypothesis at significance level ?=0.05α=0.05 if the actual mean daily precipitation is 2.6 mm or more. Computing power by hand requires two steps. The first step is to use a significance level of 0.05 to determine the values of the sample mean for which they will reject their null…arrow_forwardIn a sample of 14 randomly selected high school seniors, the mean score on a standardized test was 1197 and the standard deviation was 166.9. Further research suggests that the population mean score on this test for high school seniors is 1018. Does the t-value for the original sample fall between -to.95 and to.95? Assume that the population of test scores for high school seniors is normally distributed. fall between -to.95 and to.95 because to.95 = The t-value of t= (Round to two decimal places as needed.) Carrow_forwardA population has a mean of 200 and a standard deviation of 90. Suppose a simple random sample of size 125 is selected and is used to estimate μ. Use z-table. a. What is the probability that the sample mean will be within 18 of the population mean (to 4 decimals)? b. What is the probability that the sample mean will be within 16 of the population mean (to 4 decimals)?arrow_forward
- From a sample with n=40, the mean duration of a geyser's eruptions is 3.13 minutes and the standard deviation is 0.82 minutes. Using Chebychev's Theorem, determine at least how many of the eruptions lasted between 1.49 and 4.77 minutes.arrow_forwardA researcher is interested in estimating the mean time it takes adults to learn a certain task. He wants to be 99% confident that the mean time for a sample of adults is within 0.6 minutes of μ. In a small pilot study, the standard deviation of learning times was 6.9 minutes. How large a sample of adults should be tested?arrow_forwardThe ages of a group of 149 randomly selected adult females have a standard deviation of 16.5 years. Assume that the ages of female statistics students have less variation than ages of females in the general population, so let σ=16.5 years for the sample size calculation. How many female statistics student ages must be obtained in order to estimate the mean age of all female statisticsstudents? Assume that we want 90% confidence that the sample mean is within one-half year of the population mean. Does it seem reasonable to assume that the ages of female statistics students have less variation than ages of females in the general population? Question content area bottom Part 1 The required sample size is enter your response here.arrow_forward
- Agricultural scientists are testing a new chicken feed to see whether it increases the number of eggs laid. The scientists divided a flock in half and gave half of the chickens the new feed, while the other half were given a regular feed. The eggs laid in a one-year period for a random sample of 10 chickens using the new feed and 10 chickens using the regular feed are recorded. Assume that the population standard deviation of number of eggs laid is 12 eggs per year for both groups and that the number of eggs laid per year is normally distributed. Let the chickens given the new feed be the first sample, and let the chickens given the regular feed be the second sample. The scientists conduct a two-mean hypothesis test at the 0.05 level of significance to test if there is evidence that the new feed increases the number of eggs laid. (a) Which answer choice shows the correct null and alternative hypotheses for this test? Select the correct answer below: H0:μ1=μ2;…arrow_forwardThe ages of a group of 132 randomly selected adult females have a standard deviation of 16.1 years. Assume that the ages of female statistics students have less variation than ages of females in the general population, so let σ=16.1 years for the sample size calculation. How many female statistics student ages must be obtained in order to estimate the mean age of all female statistics students? Assume that we want 95% confidence that the sample mean is within one-half year of the population mean. Does it seem reasonable to assume that the ages of female statistics students have less variation than ages of females in the general population?The required sample size isarrow_forwardIn a random sample of 8 cell phones, the mean full retail price was $549.30 and the standard deviation was $182.00. Further research suggests that the population mean is $425.14. Does the t-value for the original sample fall between - to 95 and to 95? Assume that the population of full retail prices for cell phones is normally distributed. The t-value of t = fall between - to 95 and to 95 because to 95 (Round to two decima d.) does not doesarrow_forward
- From a sample with n = 32, the mean duration of a geyser's eruptions is 3.42 minutes and the standard deviation is 1.12 minutes. Using Chebychev's Theorem, determine at least how many of the eruptions lasted between 1.18 and 5.66 minutes. At least of the eruptions lasted between 1.18 and 5.66 minutes. (Simplify your answer.)arrow_forwardsuppose that for a sexually active male drosophila fruit fly in a particular genetics lab the population mean lifespan is 38.9 days with a population standard deviation of 12.0 days when she experimentally removed all females from a simple random sample of 24 this drosophila flies in her lab a researcher in the slab found that 24 sexually inactive males had a mean lifespan of 62.5 days with a standard deviation of 14.1 days answer the questions below about the experiment and about testing weather sexual activity affects how long males Drosophila live. How do you find the Critical Value? How do you find theP-Value? reject or fail to reject the null hypothesis?arrow_forward
arrow_back_ios
arrow_forward_ios
Recommended textbooks for you
- MATLAB: An Introduction with ApplicationsStatisticsISBN:9781119256830Author:Amos GilatPublisher:John Wiley & Sons Inc
 Probability and Statistics for Engineering and th...StatisticsISBN:9781305251809Author:Jay L. DevorePublisher:Cengage Learning
 Statistics for The Behavioral Sciences (MindTap C...StatisticsISBN:9781305504912Author:Frederick J Gravetter, Larry B. WallnauPublisher:Cengage Learning
  Elementary Statistics: Picturing the World (7th E...StatisticsISBN:9780134683416Author:Ron Larson, Betsy FarberPublisher:PEARSON
 The Basic Practice of StatisticsStatisticsISBN:9781319042578Author:David S. Moore, William I. Notz, Michael A. FlignerPublisher:W. H. Freeman
 Introduction to the Practice of StatisticsStatisticsISBN:9781319013387Author:David S. Moore, George P. McCabe, Bruce A. CraigPublisher:W. H. Freeman
MATLAB: An Introduction with Applications
Statistics
ISBN:9781119256830
Author:Amos Gilat
Publisher:John Wiley & Sons Inc
Probability and Statistics for Engineering and th...
Statistics
ISBN:9781305251809
Author:Jay L. Devore
Publisher:Cengage Learning
Statistics for The Behavioral Sciences (MindTap C...
Statistics
ISBN:9781305504912
Author:Frederick J Gravetter, Larry B. Wallnau
Publisher:Cengage Learning
Elementary Statistics: Picturing the World (7th E...
Statistics
ISBN:9780134683416
Author:Ron Larson, Betsy Farber
Publisher:PEARSON
The Basic Practice of Statistics
Statistics
ISBN:9781319042578
Author:David S. Moore, William I. Notz, Michael A. Fligner
Publisher:W. H. Freeman
Introduction to the Practice of Statistics
Statistics
ISBN:9781319013387
Author:David S. Moore, George P. McCabe, Bruce A. Craig
Publisher:W. H. Freeman