
MATLAB: An Introduction with Applications
6th Edition
ISBN: 9781119256830
Author: Amos Gilat
Publisher: John Wiley & Sons Inc
expand_more
expand_more
format_list_bulleted
Related questions
Question
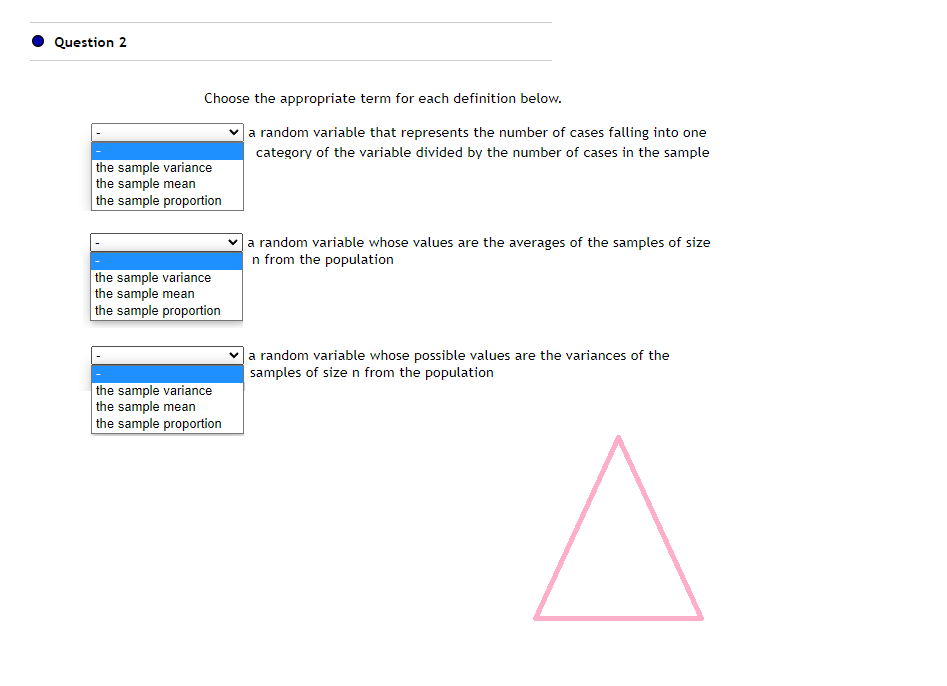

Transcribed Image Text:Question 2
Choose the appropriate term for each definition below.
a random variable that represents the number of cases falling into one
category of the variable divided by the number of cases in the sample
the sample variance
the sample mean
the sample proportion
the sample variance
the sample mean
the sample proportion
the sample variance
the sample mean
the sample proportion
a random variable whose values are the averages of the samples of size
n from the population
a random variable whose possible values are the variances of the
samples of size n from the population
Expert Solution
This question has been solved!
Explore an expertly crafted, step-by-step solution for a thorough understanding of key concepts.

Step by stepSolved in 2 steps

Knowledge Booster

Similar questions
- Textbook: Statistics for the Behavioral SciencesGregory J. Privitera Please show your work-Concept and Application Problems (Pg.133) State whether each of the following will increase, decrease, or have no effect on the population variance. The sum of squares (SS) increases. The sample size decreases. The size of the population increases.arrow_forwardMm3arrow_forwardIn looking at the results of a standardized exam, 72% of those taking the test choose the correct answer on the first question. Answer the following for 400 test takers who are to be randomly chosen. After taking the sample and administering the test, 320 of the test takers answer the first question correctly. The sample proportion is ____________________. Find the mean and variance for the distribution of sample proportions from samples of size n = 400. Mean: __________________ Variance: ___________________ The probability is ____________________ for taking another random sample of size n = 400 test takers and more than 75% of them getting the correct answer on this question.arrow_forward
- 27arrow_forwardThree randomly selected children are surveyed. The ages of the children are 2, 3, and 10. Assume that samples of size n = 2 are randomly selected with replacement from the population of 2, 3, and 10. Listed below are the nine different samples. Complete parts (a) through (d). 2,2 2,3 2,10 3,2 3,3 3,10 10,2 10,3 10,10 a. Find the value of the population variance o². (Round to three decimal places as needed.)arrow_forwardthanks for attempting my question. would appreciate a quick response and an explanation. thanks Question 1 of 4 Assume that we have 6 manifest variables and 3 factors. The communality of 3 on variable 74 is obtained with the following: 34 O B. Y 34 O D. Y43 Question 3 of 4 Assume we have 6 manifest variables and 3 factors. The proportion of variance in the 2nd manifest variable accounted for by all of the factors can be represented as follows: O A. 22 О в. C. 13 33 Y 63 O D. 2-2; = Y21 +?22+?23arrow_forward
- 3. Can SAT scores predict college performance? Let x be a variable that represents SAT score of a computer science major, and let y be a variable that represents a student’s GPA upon graduation. A random sample of n =15 computer science majors provided their SAT scores and GPAs: x 1232 1070 1086 1287 1130 1048 1121 1095 1135 1208 1333 1160 1186 1243 1261 y 3.52 2.91 2.4 3.47 3.47 2.37 2.4 2.24 3.02 3.32 3.59 2.54 3.19 3.71 3.58 The scatter diagram for the SAT score and GPA is given below: (a) Find the sample correlation coefficient r. Truncate to two decimal places. What does the value tell you about the data? (b) Find the equation of the least squares line . Truncate to four decimal places. What does the slope mean? (c) Find the value of the coefficient of determination . Truncate to two decimal places. What does this number mean? (d) What is the predicted GPA if a computer science major got a…arrow_forwardQUESTION 8 Find the mode(s) for the given sample data. 20, 38, 46, 38, 49, 38, 49 49 38 39.7 46arrow_forwardSample A Sample B s2 22 25 n 10 8 We want to test the hypothesis that population B has a smaller variance than population A.arrow_forward
- The data to the right are from independent simple random samples from three populations. Determine each of the following. Sample 1 Sample 2 Sample 3 3 3 3 a. SSTR b. MSTR c. SSE d. MSE e. F 4 2 1 8 a. SSTR= (Round to three decimal places as needed.) b. MSTR = (Round to three decimal places as needed.) c. SSE = (Round to three decimal places as needed.) d. MSE = (Round to three decimal places as needed.) e. F = (Round to three decimal places as needed.)arrow_forwardIf two large random samples are drawn from two populations, each having a mean of $100, the relevant sampling distribution of their difference has a mean of a. 200 b. The Sum of the 2 Sample Means C. 0 D. The difference between the two sample means.arrow_forward
arrow_back_ios
arrow_forward_ios
Recommended textbooks for you
- MATLAB: An Introduction with ApplicationsStatisticsISBN:9781119256830Author:Amos GilatPublisher:John Wiley & Sons Inc
 Probability and Statistics for Engineering and th...StatisticsISBN:9781305251809Author:Jay L. DevorePublisher:Cengage Learning
 Statistics for The Behavioral Sciences (MindTap C...StatisticsISBN:9781305504912Author:Frederick J Gravetter, Larry B. WallnauPublisher:Cengage Learning
  Elementary Statistics: Picturing the World (7th E...StatisticsISBN:9780134683416Author:Ron Larson, Betsy FarberPublisher:PEARSON
 The Basic Practice of StatisticsStatisticsISBN:9781319042578Author:David S. Moore, William I. Notz, Michael A. FlignerPublisher:W. H. Freeman
 Introduction to the Practice of StatisticsStatisticsISBN:9781319013387Author:David S. Moore, George P. McCabe, Bruce A. CraigPublisher:W. H. Freeman
MATLAB: An Introduction with Applications
Statistics
ISBN:9781119256830
Author:Amos Gilat
Publisher:John Wiley & Sons Inc
Probability and Statistics for Engineering and th...
Statistics
ISBN:9781305251809
Author:Jay L. Devore
Publisher:Cengage Learning
Statistics for The Behavioral Sciences (MindTap C...
Statistics
ISBN:9781305504912
Author:Frederick J Gravetter, Larry B. Wallnau
Publisher:Cengage Learning
Elementary Statistics: Picturing the World (7th E...
Statistics
ISBN:9780134683416
Author:Ron Larson, Betsy Farber
Publisher:PEARSON
The Basic Practice of Statistics
Statistics
ISBN:9781319042578
Author:David S. Moore, William I. Notz, Michael A. Fligner
Publisher:W. H. Freeman
Introduction to the Practice of Statistics
Statistics
ISBN:9781319013387
Author:David S. Moore, George P. McCabe, Bruce A. Craig
Publisher:W. H. Freeman