MATLAB: An Introduction with Applications
6th Edition
ISBN: 9781119256830
Author: Amos Gilat
Publisher: John Wiley & Sons Inc
expand_more
expand_more
format_list_bulleted
Question

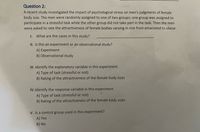
Transcribed Image Text:Question 2:
A recent study investigated the impact of psychological stress on men's judgments of female
body size. The men were randomly assigned to one of two groups; one group was assigned to
participate in a stressful task while the other group did not take part in the task. Then the men
were asked to rate the attractiveness of female bodies varying in size from emaciated to obese.
I.
What are the cases in this study?
II. Is this an experiment or an observational study?
A) Experiment
B) Observational study
II. Identify the explanatory variable in this experiment.
A) Type of task (stressful or not)
B) Rating of the attractiveness of the female body sizes
IV. Identify the response variable in this experiment.
A) Type of task (stressful or not)
B) Rating of the attractiveness of the female body sizes
V. Is a control group used in this experiment?
A) Yes
B) No
Expert Solution
arrow_forward
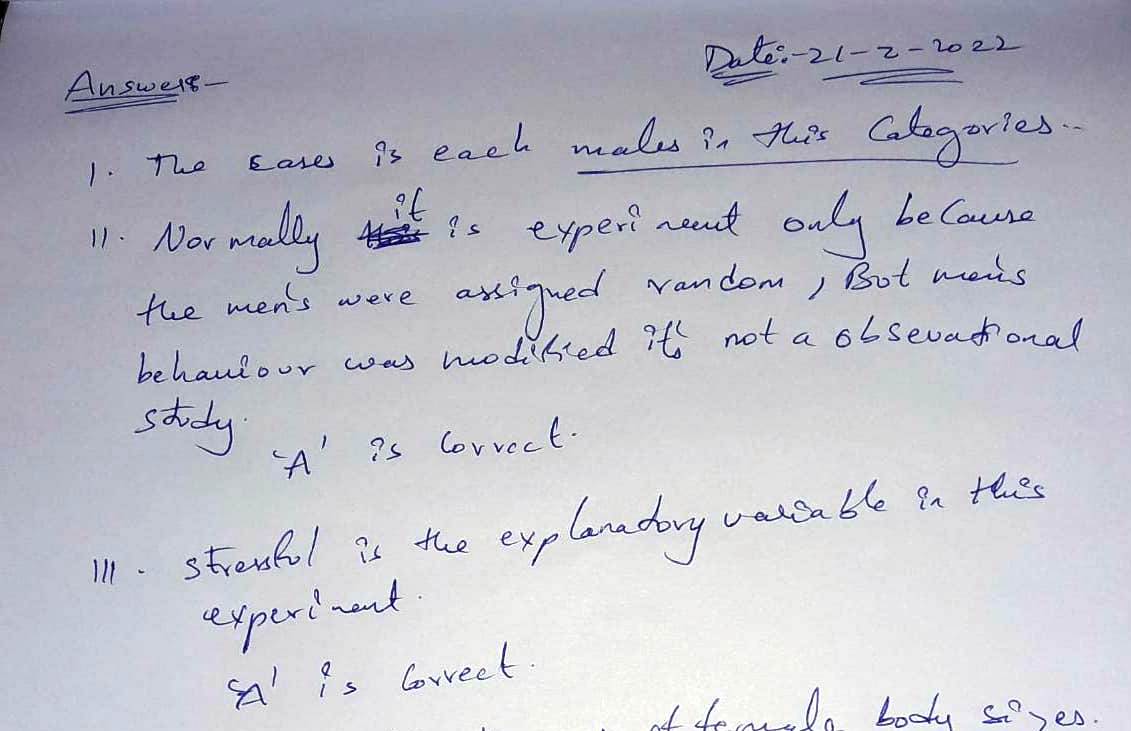
Step 1

Trending nowThis is a popular solution!
Step by stepSolved in 2 steps with 2 images

Knowledge Booster
Similar questions
- QUESTION 18 A researcher notes that there seems to be a difference in the prevalence of high blood pressure among college-educated individuals who consume low amounts of processed foods and the prevalence of individuals who only have a high school education and consume high amounts of processed foods. Use the appropriate hypothesis to test for the independence of the two independent variables presented here at the 5% significance level to ensure confounding has not influenced the study’s results. Then, interpret your response. Diet Low in Processed Foods Normal BP High BP Total College Education 124 55 179 High School Education 69 152 221 Total 193 207 400 Diet High in Processed Foods Normal BP High BP Total College Education 64 85 149 High School Education 98 153 251 Total 162 238 400 The chi square value of 37.724 is higher than the chi square value of 3.84; therefore, we do not reject H0 at the 5% level and reject H1, which states that level…arrow_forwardIn a study examining the effect of humor on interpersonal attractions, McGee and Shevlin (2009) found that a man's sense of humor had significant effect on how he was perceieved by woman. In the study, female college students were given brief descriptions of a po tential romantic partner and then rated the attractiveness of the male on a scale from 1 (low) to 7 (high). The fictitious male was described positively as being single , ambitious, and having good job prospects. In one dition, the description also said that he had a great sense of humor. The results showed that the description was rated significantly higher when "a sense of humor" was included. To further examine this effect, a researcher selected a sample of n = 16colle college males and asked them to read a brief description of a female and then rate the attractiveness of the woman in the description . The description had been used in previous research but was modified by adding a statement describing a good sense of humor…arrow_forwardIn an early study of the effects of frustration on feelings of hostility, Miller and Bugelski (1948) had a group of boys at a camp rate their attitudes toward two groups (Mexicans and Japanese). The campers then participated in a long, difficult, frustrating testing session that kept them away from their weekly movie. Finally the boys again rated their attitudes towards the minority groups. The scores below represent the number of unfavorable traits attributed to minorities and are similar to those of miller and Bugelski. Participant Before After A 5 6 B 4 4 C 3 5 D 3 4 E 2 4 F 2 3 G 1 3 H 0 2 a. Does the intervening unpleasant task alter attitudes toward the two…arrow_forward
- Suppose you were presented with the results of a study comparing two different training methods for basketball athletes. You are told 32 athletes were randomly assigned to the two groups so that 16 were in the group A and 16 were in the group B. At the end of the session, the average scores (wins versus losses) of the two groups/teams were compared and a difference of 10% was observed ( the first team had 10% more wins than the second). The coach observer reports two- sample t-test shows this difference is statistically significant. How would you interpret these findings? What questions or concerns would you have? How might this type of study be improved? Hint: Consider the possibility that the test performed was not the appropriate one.arrow_forwardHow would you find (a.) and (b.)?? As well as finding the test statistic and p-value?arrow_forwardStudy 2: Pill Appearance and Perceived Pain. Does the shape or color of a pain pill influence its effectiveness? Although logically it shouldn’t, whether we believe a drug will work does have a powerful effect on our perceptions (e.g., placebo effect). In this experiment, 4 groups of adult patients were given the same amount of Advil after dental surgery for pain relief, but the color and shape of the pill varied. Researchers hypothesized that an unusual shape or color would lead people to believe the pills were new and special and thus would expect them to be more effective than common round, white pills. Researchers also wanted to know if there is an interaction between shape and color Data Labels ShapePill {1=Round; 2=Diamond} ColorPill {1=White; 2=BlueGreen} Gender {0=Woman; 1=Man; 2=Nonbinary person) Descriptions of the Variables and Descriptive Statistics: Referring to the JASP output, and using sentences, present the descriptive statistics of each group: for example:…arrow_forward
- These two questions please.arrow_forwardA health insurance company is looking at the use of its benefits by its members. It randomly selects 500 members for further study, and one of the pieces of information they collect is the amount the amount of money spent on prescription medications over the past year. The average amount among the 500 members is $600 and the SD is $1,000. A histogram of the amounts is quite skewed to the right, and 40 (8%) of the sampled members have spent $5000 or more on prescription medications in the past year. Calculate a 95%-confidence interval for the percentage of all members who have spent $5000 or more on prescription medications in the last year.arrow_forwardMicah is interested in testing whether college students' levels of gratitude change over the course of the semester. He randomly selects a sample of 100 students and assesses their levels of gratitude at the beginning, and end of the semester. Question 17 options: ANOVA Paired samples t test Independent samples t test Correlationarrow_forward
arrow_back_ios
arrow_forward_ios
Recommended textbooks for you
 MATLAB: An Introduction with ApplicationsStatisticsISBN:9781119256830Author:Amos GilatPublisher:John Wiley & Sons Inc
 Probability and Statistics for Engineering and th...StatisticsISBN:9781305251809Author:Jay L. DevorePublisher:Cengage Learning
 Statistics for The Behavioral Sciences (MindTap C...StatisticsISBN:9781305504912Author:Frederick J Gravetter, Larry B. WallnauPublisher:Cengage Learning
 Elementary Statistics: Picturing the World (7th E...StatisticsISBN:9780134683416Author:Ron Larson, Betsy FarberPublisher:PEARSON
 The Basic Practice of StatisticsStatisticsISBN:9781319042578Author:David S. Moore, William I. Notz, Michael A. FlignerPublisher:W. H. Freeman
 Introduction to the Practice of StatisticsStatisticsISBN:9781319013387Author:David S. Moore, George P. McCabe, Bruce A. CraigPublisher:W. H. Freeman

MATLAB: An Introduction with Applications
Statistics
ISBN:9781119256830
Author:Amos Gilat
Publisher:John Wiley & Sons Inc

Probability and Statistics for Engineering and th...
Statistics
ISBN:9781305251809
Author:Jay L. Devore
Publisher:Cengage Learning

Statistics for The Behavioral Sciences (MindTap C...
Statistics
ISBN:9781305504912
Author:Frederick J Gravetter, Larry B. Wallnau
Publisher:Cengage Learning

Elementary Statistics: Picturing the World (7th E...
Statistics
ISBN:9780134683416
Author:Ron Larson, Betsy Farber
Publisher:PEARSON

The Basic Practice of Statistics
Statistics
ISBN:9781319042578
Author:David S. Moore, William I. Notz, Michael A. Fligner
Publisher:W. H. Freeman

Introduction to the Practice of Statistics
Statistics
ISBN:9781319013387
Author:David S. Moore, George P. McCabe, Bruce A. Craig
Publisher:W. H. Freeman