ENGR.ECONOMIC ANALYSIS
14th Edition
ISBN: 9780190931919
Author: NEWNAN
Publisher: Oxford University Press
expand_more
expand_more
format_list_bulleted
Question

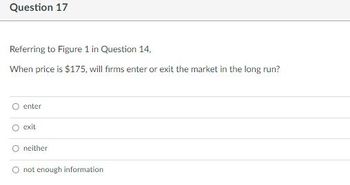
Transcribed Image Text:Question 17
Referring to Figure 1 in Question 14,
When price is $175, will firms enter or exit the market in the long run?
Ⓒenter
O exit
neither
not enough information

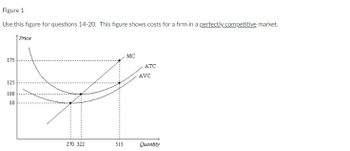
Transcribed Image Text:Figure 1
Use this figure for questions 14-20. This figure shows costs for a firm in a perfectly competitive market.
Price
MC
ATC
AVC
270 322
Quantity
175
125
100
80
515
Expert Solution
This question has been solved!
Explore an expertly crafted, step-by-step solution for a thorough understanding of key concepts.
This is a popular solution
Trending nowThis is a popular solution!
Step by stepSolved in 2 steps

Knowledge Booster
Learn more about
Need a deep-dive on the concept behind this application? Look no further. Learn more about this topic, economics and related others by exploring similar questions and additional content below.Similar questions
- Quizzes 2 $15+ $12 $10+ $7 0000 FIRM I MC ATC AVC q 20 30 38 48 55 The above graph represents a firm in a perfectly competitive market. If the price the firm receives for its product is $10 and the firm is producing a profit-maximizing quantity, then what is the firm's profit? -$60 $96 $114 $0arrow_forwardMacmillan Learning Ⓒ The graph contains individual supply curves for the only two firms in a hypothetical market for stuffed animals. Place the market supply curve at the correct location on the graph. Then, consider what would happen to the market if a third supplier enters the market, holding all else constant. Price per Stuffed Animal ($) 10 Incorrect 8 7 6 5 4 3 2 11 0 0 Market for Stuffed Animals Firm 1 Market Firm 2 1,000 2,000 3,000 4,000 5,000 6,000 7,000 8,000 9,000 10,000 Quantity of Stuffed Animals A third firm would mean market supply increases.arrow_forwardATC MC Z AVC V. W $13 $10 T $7 $4 N 5 7 9 10 12 144 The graph above shows cost curves of a firm in a competitive market. Several points are marked on the graph to allow tracing curves. Some of them can also be used to indicate various prices. Refer to the graph to answer the following questions: 1. The short-run supply of the firm can be traced by connecting points 2. If the market price is $4 then in the short-run the firm would supply units. At this price the firm would 3. If the market price is $10 then in the short-run the firm would supply units. At this price the firm would 4. If the market price is $7 then in the short-run the firm would supply units. At this price the firm would 5. In the short run, the firm is better off continuing to operate (i.e. Q>0) despite losses if the price is in the interval above and below %24arrow_forward
- 4. Profit maximization in the cost-curve diagram The following graph plots daily cost curves for a firm operating in the competitive market for demin overalls. Hint: Once you have positioned the rectangle on the graph, select a point to observe its coordinates. PRICE (Dollars per overalls): 50 45 40 35 25 20 15 10 5 0 0 2 MC ATC 6 AVC 4 8 10 12 14 16 QUANTITY (Thousands of overallses per day) 18 20 Profit or Lossarrow_forwardSub : EconomicsPls answer very fast.I ll upvote. Thank Youarrow_forwardst.ca/ 2. If you are operating a business in a perfectly competitive market. You can sell as much as at the market price. Why can you not simply increase your profits by selling a highest quantity? Answer: 3. Your company operates in a perfectly competitive market. Your Manager told you that advertising can help you increase your sales in the short run. What kind of advertising campaign you will start for your product and how much gain is expected from an effective advertisement? Answer: 4. Suppose you are running a business and thinking to enter the monopoly market. As per your calculation, you can make a profit by keeping your product price 20% less than the monopolist. Explain, how the monopolist might react to stop you to enter the business? Answer: 5. The real GDP per capita of many countries such as China and Korea are greater than that of the US. Does this indicate that these countries will eventually overtake the US in terms of the growth rate of real GDP per capita? Explain.…arrow_forward
- Use the information in the graphs below to answer the following questions SAb $/gal 25- S1 25 H MC ATC 20 20 15 15 P1 10 10 P2 5 4 6 8 10 2. Thousands of gal/week 1 3 Millions of gal/week What is the long-run equilibrium price in this market? Please enter your answers as whole numbers with and do not type out your answer in words (ie. $5 or $5.00 not "Five dollars"). How many gallons per week will the individual firm produce to maximize profits in equilibrium? Please enter your answers as whole numbers with no extra words (ie. 5000 not "5000 gallons/week"). What is the individual firm's long run economic profit?arrow_forward13. Firms in Competitive Markets The market for fertilizer is perfectly competitive. Firms in the market are producing output but are currently making economic losses. Which of the following statements is true about the price of fertilizer? Check all that apply. The price of fertilizer must be less than average total cost. The price of fertilizer must be less than marginal cost. The price of fertilizer must be equal to average variable cost. The following graphs show the cost curves faced by a typical firm, the demand for fertilizer, and possible price and supply curves. Prics and Cast MC Firm Demand Quantity Market Quantity (?) If firms in the market are producing output but are currently making economic losses, market, and indicates the corresponding supply curve. illustrates the present situation for the typical firm in the Assuming there is no change in either demand or the firm's cost curves, which of the following statements is true about what will happen in the long run? Check…arrow_forwardNeed help with graphing and understanding problemsarrow_forward
- 8. Refer to the information in the table below to answer the following questions: TVC €0 10 15 Quantity of fruit baskets 0 1 2 3 4 5 6 TFC €50 50 50 50 50 50 50 21 31 46 68 TC MC -- 10 5 6 10 15 22 a) The firm sells fruit baskets in a perfectly competitive market. Calculate the firm's total cost for each level of production and complete the table. b) Assume that the market price of a fruit basket is €15. To maximize profit, how many fruit baskets should the firm sell? c) At the profit-maximizing quantity, what is the profit?arrow_forward18 Market Representative Firm MC i of A a $7 MR = P ATC b $5 AVC $2 D1 18,000 70 100 115 Quantity (Q) Output (Q) The diagram above shows a Perfectly Competitive market on the left, and a representative firm supplying in that market on the right. In the long run we would expect the market and the Price to Select one: a. existing firms to exit; increase b. new firms to enter; increase С. new firms to enter; decrease d. existing firms to exit; decrease Price $$$arrow_forward4. Profit maximization in the cost-curve diagram The following graph plots daily cost curves for a firm operating in the competitive market for motor scooters. Hint: Once you have positioned the rectangle on the graph, select a point to observe its coordinates. PRICE (Dollars per scooter) 100 90 80 70 60 50 40 40 30 ATC 20 MC AVC 10 0 0 10 20 30 40 50 60 70 80 90 100 QUANTITY (Thousands of scooters per day) Profit or Loss ? In the short run, given a market price equal to $45 per scooter, the firm should produce a daily quantity of 45,000 scooters. On the preceding graph, use the blue rectangle (circle symbols) to fill in the area that represents profit or loss of the firm given the market price of $45 and the quantity of production from your previous answer. Note: In the following question, enter a positive number regardless of whether the firm earns a profit or incurs a loss. The rectangular area represents a short-run of $ thousand per day for the firm.arrow_forward
arrow_back_ios
SEE MORE QUESTIONS
arrow_forward_ios
Recommended textbooks for you

 Principles of Economics (12th Edition)EconomicsISBN:9780134078779Author:Karl E. Case, Ray C. Fair, Sharon E. OsterPublisher:PEARSON
 Engineering Economy (17th Edition)EconomicsISBN:9780134870069Author:William G. Sullivan, Elin M. Wicks, C. Patrick KoellingPublisher:PEARSON
 Principles of Economics (MindTap Course List)EconomicsISBN:9781305585126Author:N. Gregory MankiwPublisher:Cengage Learning
 Managerial Economics: A Problem Solving ApproachEconomicsISBN:9781337106665Author:Luke M. Froeb, Brian T. McCann, Michael R. Ward, Mike ShorPublisher:Cengage Learning
 Managerial Economics & Business Strategy (Mcgraw-...EconomicsISBN:9781259290619Author:Michael Baye, Jeff PrincePublisher:McGraw-Hill Education


Principles of Economics (12th Edition)
Economics
ISBN:9780134078779
Author:Karl E. Case, Ray C. Fair, Sharon E. Oster
Publisher:PEARSON

Engineering Economy (17th Edition)
Economics
ISBN:9780134870069
Author:William G. Sullivan, Elin M. Wicks, C. Patrick Koelling
Publisher:PEARSON

Principles of Economics (MindTap Course List)
Economics
ISBN:9781305585126
Author:N. Gregory Mankiw
Publisher:Cengage Learning

Managerial Economics: A Problem Solving Approach
Economics
ISBN:9781337106665
Author:Luke M. Froeb, Brian T. McCann, Michael R. Ward, Mike Shor
Publisher:Cengage Learning

Managerial Economics & Business Strategy (Mcgraw-...
Economics
ISBN:9781259290619
Author:Michael Baye, Jeff Prince
Publisher:McGraw-Hill Education