
MATLAB: An Introduction with Applications
6th Edition
ISBN: 9781119256830
Author: Amos Gilat
Publisher: John Wiley & Sons Inc
expand_more
expand_more
format_list_bulleted
Related questions
Question
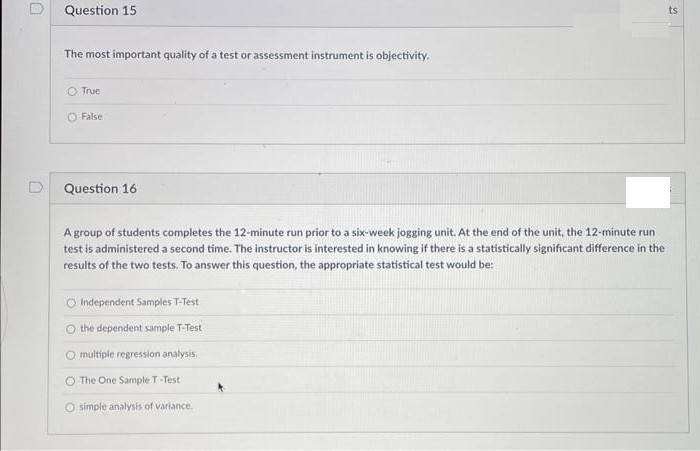

Transcribed Image Text:Question 15
The most important quality of a test or assessment instrument is objectivity.
True
O False
Question 16
A group of students completes the 12-minute run prior to a six-week jogging unit. At the end of the unit, the 12-minute run
test is administered a second time. The instructor is interested in knowing if there is a statistically significant difference in the
results of the two tests. To answer this question, the appropriate statistical test would be:
O Independent Samples T-Test
O the dependent sample T-Test
O multiple regression analysis.
The One Sample T-Test
O simple analysis of variance.
ts
Expert Solution
This question has been solved!
Explore an expertly crafted, step-by-step solution for a thorough understanding of key concepts.

This is a popular solution

Trending nowThis is a popular solution!

Step by stepSolved in 2 steps

Knowledge Booster

Similar questions
- What is the sample difference in means? Question 7 options: a. Lake Rick sample is non-normal, so no comparison is possible. b. 0.5125 kg c. observed p= 0.0167, reject Ho: mean(1) - mean(2) =0 at =0.05. d. +- 0.5 kg e. 0.6572 kgarrow_forwardYou are interested in testing if there is an association between marital status (married vs. never married) and BMI (quantitative). Which of the following is the most appropriate statistical test that you will you use? A. One-sample T-testB. Independent Sample t-testC. Chi Square testD. None of the abovearrow_forwardA psychologist wants to demonstrate the effectiveness of ACT therapy for the treatment of depression. 30 people who were seeking treatment for depression asked to complete the Beck depression inventory (BDI) before the first sessionof therapy and again after one month of therapy. Which statistical test would be best to determine if there is a significant difference between measures? One sample t-test Dependent samples t-test Independent samples t- test ANOVAarrow_forward
- Dr. Carlton conducts a study to determine the effectiveness of a new intervention for those suffering from eating disorders. He compares patients' weights before the intervention to the same patients' weights after the intervention. What is the appropriate statistical test? a. paired samples t test b. between-subjects, one-way ANOVA. c. independent-samples t test d. Mann–Whitney U testarrow_forwardDe SFU The analgesic effects of music are well known, but most of the studies have been done with adults and most of the music has been classical. You want to know whether children who choose their own music or audiobook to listen to after a surgery experience less pain and whether that depends on a severity of a surgery. To answer this question, you asked children who underwent minor and major surgeries to listen to music or a story of their choice, or to sit with noise-cancelling headphones for 30 minutes and then to point to a pain face that best illustrated their level of pain. PAIN MEASUREMENT SCALEarrow_forwardA dietitian wishes to see if a person's cholesterol level will change if the diet is supplemented by a certain mineral. Seven subjects were pretested and then took the mineral supplement for a six-week period. The results are shown below in the table. Use a paired samples t-chart at a = 0.01 significance level to see difference (Before - After) between the cholesterol levels. State the hypotheses and conclusion. Also, conduct a 99% confidence interval. Subject 1 Before 210 After 190 2 205 170 3 208 210 4 192 188 5 178 173 6 244 228 7 211 198arrow_forward
- An article compared five different methods for teaching descriptive statistics. The five methods were traditional lecture and discussion, programmed textbook instruction, programmed text with lectures computer instruction, and computer instruction with lectures. 60 students were randomly assigned, 12 to each method. After completing the course, students took a 1-hour exam. We are interested in finding out if the average test scores are different for the different teaching methods. The p-value of the test is 0.0372. What is the conclusion of the test if the level of significance is αα=0.10? There is enough evidence to conclude that all five group means are significantly different from each other. There is not enough evidence to conclude that all five group means are sigificantly different from one another. There is enough evidence to conclude that at least one group mean is significantly different from others. There is not enough evidence to conclude that at least one…arrow_forwardConsider the following research questions/study scenarios. For each study, discuss the most appropriate methods for describing the data (graphically and numerically). What statistical method would be most appropriate for addressing the research questions? Be sure to provide a justification of the statistical method. What statistical test is needed, provide appropriate null and research hypotheses. An investigation of the association between drink preferences and the color of teeth is proposed. Subjects will be surveyed as to the type of drink most often consumed (coffee/tea. Juice, caramel-colored soda, water, or milk). A clinical exam will be performed after dental cleaning to determine the color of the teeth (reddish brown, reddish yellow, gray, reddish gray).arrow_forwardA professor wanted to determine if the GPAS of students at Saddleback College are less consistent than the GPAS of students at Irvine Valley College. To test this, he obtains random samples of students from both colleges and records their GPAS, which are given below. Test the professor's claim at the a=0.05 level of significance. Saddleback College Irvine Valley College 3.7 3.2 3.0 2.5 2.7 3.6 4.0 3.4 3.8 3.2 3.0 2.5 3.6 2.8 2.6 2.5 2.1 2.7 3.9 3.4 2.0 2.2 2.7 3.1 2.0 2.0 2.1 3.8 3.1 2.9 3.2 2.8 Calculator Function [ Select] [ Select] 2-PropZTest ANOVA X^2-Test T-Test 2-SampTTest 2-SampFTest [ Select] v sufficient evidence that the standard deviation of grades for Saddleback College students is [ Select] than the standard deviation for Irvine Valley College students.arrow_forward
arrow_back_ios
arrow_forward_ios
Recommended textbooks for you
- MATLAB: An Introduction with ApplicationsStatisticsISBN:9781119256830Author:Amos GilatPublisher:John Wiley & Sons Inc
 Probability and Statistics for Engineering and th...StatisticsISBN:9781305251809Author:Jay L. DevorePublisher:Cengage Learning
 Statistics for The Behavioral Sciences (MindTap C...StatisticsISBN:9781305504912Author:Frederick J Gravetter, Larry B. WallnauPublisher:Cengage Learning
  Elementary Statistics: Picturing the World (7th E...StatisticsISBN:9780134683416Author:Ron Larson, Betsy FarberPublisher:PEARSON
 The Basic Practice of StatisticsStatisticsISBN:9781319042578Author:David S. Moore, William I. Notz, Michael A. FlignerPublisher:W. H. Freeman
 Introduction to the Practice of StatisticsStatisticsISBN:9781319013387Author:David S. Moore, George P. McCabe, Bruce A. CraigPublisher:W. H. Freeman
MATLAB: An Introduction with Applications
Statistics
ISBN:9781119256830
Author:Amos Gilat
Publisher:John Wiley & Sons Inc
Probability and Statistics for Engineering and th...
Statistics
ISBN:9781305251809
Author:Jay L. Devore
Publisher:Cengage Learning
Statistics for The Behavioral Sciences (MindTap C...
Statistics
ISBN:9781305504912
Author:Frederick J Gravetter, Larry B. Wallnau
Publisher:Cengage Learning
Elementary Statistics: Picturing the World (7th E...
Statistics
ISBN:9780134683416
Author:Ron Larson, Betsy Farber
Publisher:PEARSON
The Basic Practice of Statistics
Statistics
ISBN:9781319042578
Author:David S. Moore, William I. Notz, Michael A. Fligner
Publisher:W. H. Freeman
Introduction to the Practice of Statistics
Statistics
ISBN:9781319013387
Author:David S. Moore, George P. McCabe, Bruce A. Craig
Publisher:W. H. Freeman