
MATLAB: An Introduction with Applications
6th Edition
ISBN: 9781119256830
Author: Amos Gilat
Publisher: John Wiley & Sons Inc
expand_more
expand_more
format_list_bulleted
Related questions
Question

Transcribed Image Text:Question 15
<
0/1 pt 3 2 Details
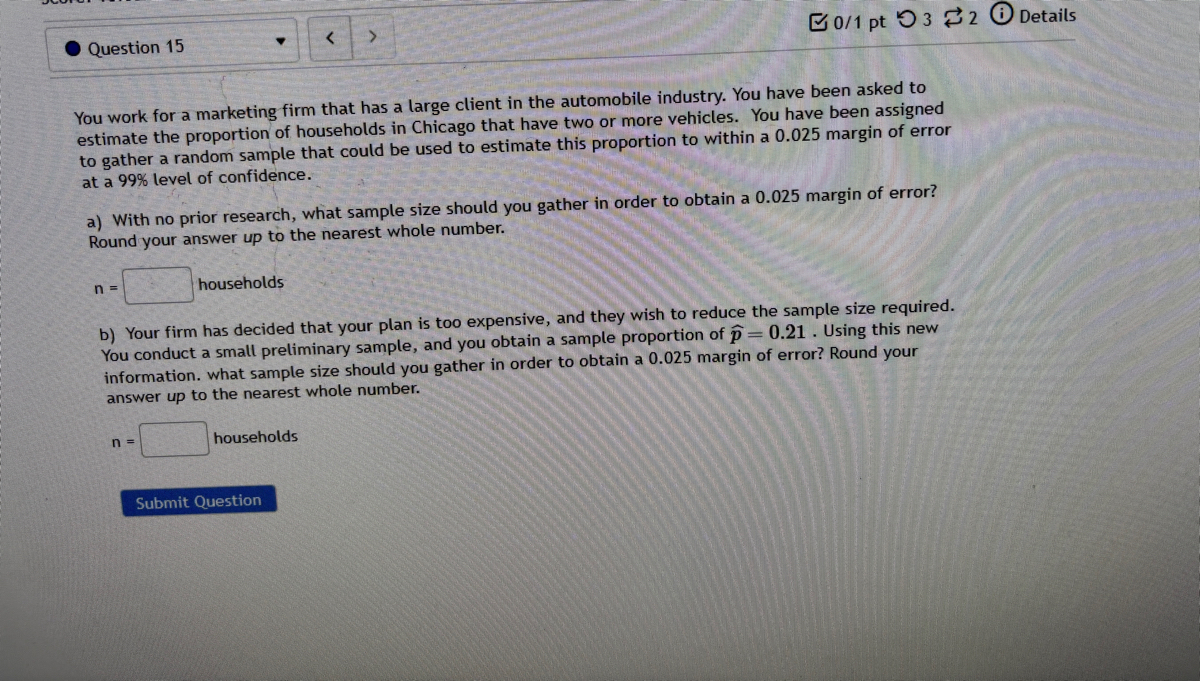
You work for a marketing firm that has a large client in the automobile industry. You have been asked to
estimate the proportion of households in Chicago that have two or more vehicles. You have been assigned
to gather a random sample that could be used to estimate this proportion to within a 0.025 margin of error
at a 99% level of confidence.
a) With no prior research, what sample size should you gather in order to obtain a 0.025 margin of error?
Round your answer up to the nearest whole number.
n =
households
b) Your firm has decided that your plan is too expensive, and they wish to reduce the sample size required.
You conduct a small preliminary sample, and you obtain a sample proportion of p=0.21. Using this new
information. what sample size should you gather in order to obtain a 0.025 margin of error? Round your
answer up to the nearest whole number.
n =
households
Submit Question
Expert Solution
This question has been solved!
Explore an expertly crafted, step-by-step solution for a thorough understanding of key concepts.

This is a popular solution

Trending nowThis is a popular solution!

Step by stepSolved in 2 steps

Knowledge Booster

Similar questions
- One of the more popular statistics reported in the media is the president's job approval rating. The approval rating is reported as the proportion of the population who approve of the job that the sitting president is doing and is typically based on a random sample of registered voters. Complete parts (a) and (b) below. (This is a reading assessment question. Be certain of your answer because you only get one attempt on this question.) a) This proportion tends to fluctuate from week to week. Name some reasons for the fluctuation in the statistic. Select all valid reasons below. A. The proportion could be changing due to a large change in the composition of the population. B. The proportion could be changing due to sampling error; different people are in the sample. C. The proportion could be changing because the sampling size of the poll is changing. D. The proportion could be changing because people's attitudes are changingarrow_forwardA reseacher is analyzing data from a repeated-measures research study. If the researcher ran a related samples/repeated measures t-test to analyze the data, what would the value of SS be for the analysis? Subject 1st 2nd #1 10 11 #2 4 6 #3 7 9 #4 6 5 A. 10 B. 1 C. 4 D. 6arrow_forwardA power analysis is a calculation used to estimate the smallest sample size needed for an experiment, given a required significance level, statistical power, and effect size. It helps to determine if a result from an experiment or survey is due to chance, or if it is genuine and significant. Think of an experiment or a survey that you have conducted or will conduct in your field of interest and use it to discuss the following questions: 1. Describe the importance of power analysis in an experiment. 2. How will you determine the appropriate significance level for a power analysis? 3. Explain, in your own words, how you will conduct a power analysis in your experiment or survey.arrow_forward
- A student wishes to determine the average life-span of a household light bulb. She randomly collects 15 light bulbs. The issue that may arise from her survey is… The bias will be high. The accuracy will be low. The precision will be low. The standard error will be too low.arrow_forwardAn article claims that 70% of adults over 50 take vitamin supplements. To test this claim, you take a sample and do your math. Based on your results, you end up rejecting the claim. Later it turns out that the claim was in fact correct. What type of error did you make, if any? No error was made. A type II error A type I errorarrow_forwarda) Work this problem manually (by hand) using the procedures and formulas for ANOVA to check if the Population Means for flying time before major maintenance is required are the same for the three types of aircraft. To help you, Sample Means and Sample Variances have been calculated below for you: Airbus Boeing737 Boeing 787 6.4 8.7 9.9 7.8 7.4 12.8 5.3 9.4 12.1 7.4 10.1 10.8 8.4 9.2 11.3 7.3 9.8 11.5 __________________________________________________________________ Sample Mean 7.1…arrow_forward
- In a simple random sample of 1200 young people, 86% had earned a high school diploma. What is the standard error for this estimate of the percentage of all young people who earned a high school diploma?arrow_forwardA publisher reports that 69 % of their readers own a particular make of car. A marketing executive wants to test the claim that the percentage is actually under the reported percentage. A random sample of 200 found that 60% of the readers owned a particular make of car. Is there sufficient evidence at the 0.10 level to support the executive's claim? Step 5 of 7: Identify the value of the level of significance.arrow_forwardSuppose a researcher wants to estimate the population proportion of defective light bulbs. He took a random sample of 800 light bulbs and 40 of them found out to be defective. Suppose the researcher claims that the defective proportion of light bulb is less than 7%. Suppose he wants to test this claim at 5% significance level. Calculate the test statistics. (Round your answer to two decimal places )arrow_forward
arrow_back_ios
arrow_forward_ios
Recommended textbooks for you
- MATLAB: An Introduction with ApplicationsStatisticsISBN:9781119256830Author:Amos GilatPublisher:John Wiley & Sons Inc
 Probability and Statistics for Engineering and th...StatisticsISBN:9781305251809Author:Jay L. DevorePublisher:Cengage Learning
 Statistics for The Behavioral Sciences (MindTap C...StatisticsISBN:9781305504912Author:Frederick J Gravetter, Larry B. WallnauPublisher:Cengage Learning
  Elementary Statistics: Picturing the World (7th E...StatisticsISBN:9780134683416Author:Ron Larson, Betsy FarberPublisher:PEARSON
 The Basic Practice of StatisticsStatisticsISBN:9781319042578Author:David S. Moore, William I. Notz, Michael A. FlignerPublisher:W. H. Freeman
 Introduction to the Practice of StatisticsStatisticsISBN:9781319013387Author:David S. Moore, George P. McCabe, Bruce A. CraigPublisher:W. H. Freeman
MATLAB: An Introduction with Applications
Statistics
ISBN:9781119256830
Author:Amos Gilat
Publisher:John Wiley & Sons Inc
Probability and Statistics for Engineering and th...
Statistics
ISBN:9781305251809
Author:Jay L. Devore
Publisher:Cengage Learning
Statistics for The Behavioral Sciences (MindTap C...
Statistics
ISBN:9781305504912
Author:Frederick J Gravetter, Larry B. Wallnau
Publisher:Cengage Learning
Elementary Statistics: Picturing the World (7th E...
Statistics
ISBN:9780134683416
Author:Ron Larson, Betsy Farber
Publisher:PEARSON
The Basic Practice of Statistics
Statistics
ISBN:9781319042578
Author:David S. Moore, William I. Notz, Michael A. Fligner
Publisher:W. H. Freeman
Introduction to the Practice of Statistics
Statistics
ISBN:9781319013387
Author:David S. Moore, George P. McCabe, Bruce A. Craig
Publisher:W. H. Freeman