
A First Course in Probability (10th Edition)
10th Edition
ISBN: 9780134753119
Author: Sheldon Ross
Publisher: PEARSON
expand_more
expand_more
format_list_bulleted
Related questions
Question
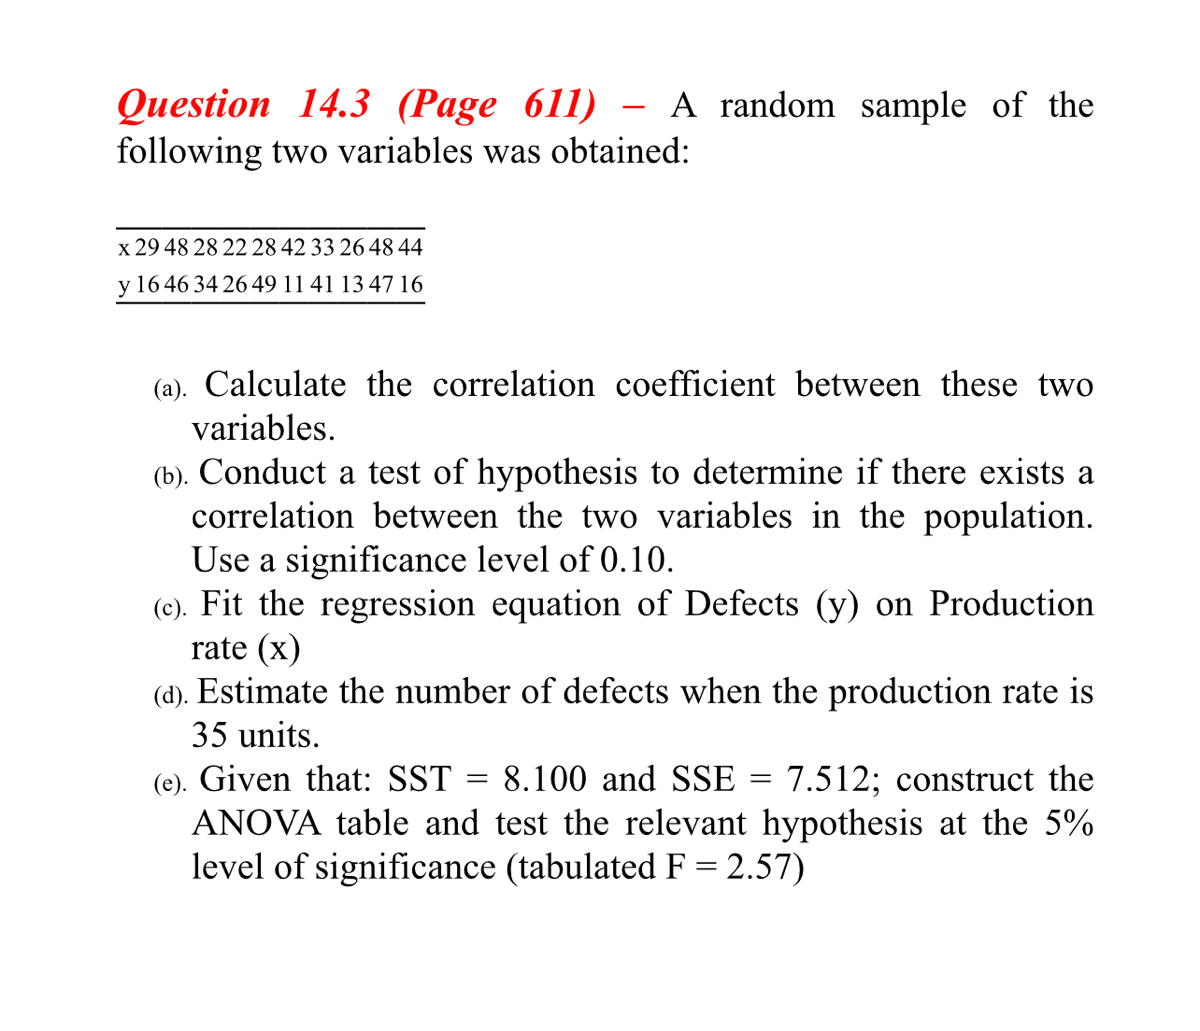

Transcribed Image Text:Question 14.3 (Page 611) - A random sample of the
following two variables was obtained:
x 29 48 28 22 28 42 33 26 48 44
y 16 46 34 26 49 11 41 13 4716
(a). Calculate the correlation coefficient between these two
variables.
(b). Conduct a test of hypothesis to determine if there exists a
correlation between the two variables in the population.
Use a significance level of 0.10.
(c). Fit the regression equation of Defects (y) on Production
rate (x)
(d). Estimate the number of defects when the production rate is
35 units.
(e). Given that: SST = 8.100 and SSE
ANOVA table and test the relevant hypothesis at the 5%
level of significance (tabulated F = 2.57)
7.512; construct the
Expert Solution
This question has been solved!
Explore an expertly crafted, step-by-step solution for a thorough understanding of key concepts.

Step by stepSolved in 2 steps with 3 images

Knowledge Booster

Similar questions
- The data is given as follow. xi 2 6 9 13 20 Vi 7 18 9 26 23 The estimated regression equation for these data is y7.6 + .9x. Compute SSE, SST, and SSR (to 1 decimal) SSE SST SSR What percentage of the total sum of squares can be accounted for by the estimated regression equation (to 1 decimal)? What is the value of the sample correlation coefficient (to 3 decimals)?arrow_forwardSuppose a doctor measures the height, x, and head circumference, y, of 11 children and obtains the data below. The correlation coefficient is 0.883 and the least squares regression line is y = 0.134x + 13.693. Complete parts (a) and (b) below. Height, x Head Circumference, y 17.4 27.75 25.25 26 25.25 27.25 26.75 26 27.25 27 27.25 26.75 17.1 17.3 17.0 17.4 17.2 17.2 17.3 17.3 17.4 17.3 ..... (a) Compute the coefficient of determination, R?. R? % (Round to one decimal place as needed.) (b) Interpret the coefficient of determination. Approximately % of the variation in is explained by the least-squares gression model. (Round to one decimal place as needed.)arrow_forwardThe U.S. Department of Energy’s Fuel Economy Guide provides fuel efficiency data for cars and trucks. The following regression output was obtained for a sample of 45 cars. The variable of interest is highway miles per gallon (Hwy MPG). The independent variables used in the analysis are as follows: The class of the vehicle: Compact, Midsize or Large. Midsize = 1 if the car is a midsize, 0 otherwise. Similarly, Large = 1 if it is a large car, 0 otherwise. Displcement: The engine displacement (size) in liters Premium: Equals 1 if premium fuel is used, 0 if regular fuel is used Cylinders: Number of cylinders Regression Statistics Multiple R 0.90 R Square Adjusted R Square 0.79 Standard Error 1.78 Observations 45 ANOVA df SS MS F Significance F…arrow_forward
- need help. pleasearrow_forwardI need help answering this question.arrow_forwarda) Compute the value of the sample correlation coefficient, r. (Round your answer to four decimal places.) r = b) Calculate the test statistic and determine the P-value. (Round your test statistic to one decimal place and your P-value to three decimal places.) t = P- value = c) If a regression analysis were to be carried out to predict endurance from lactate level, what proportion of observed variation in endurance could be attributed to the approximate linear relationship? Answer the question without doing any regression calculations. (Round your answer to four decimal places.) ____________ d) If a regression analysis were to be carried out to predict lactate level from endurance, what proportion of observed variation in endurance could be attributed to the approximate linear relationship? Answer the question without doing any regression calculations. (Round your answer to four decimal places.) _____________arrow_forward
arrow_back_ios
arrow_forward_ios
Recommended textbooks for you
- A First Course in Probability (10th Edition)ProbabilityISBN:9780134753119Author:Sheldon RossPublisher:PEARSON

A First Course in Probability (10th Edition)
Probability
ISBN:9780134753119
Author:Sheldon Ross
Publisher:PEARSON