MATLAB: An Introduction with Applications
6th Edition
ISBN: 9781119256830
Author: Amos Gilat
Publisher: John Wiley & Sons Inc
expand_more
expand_more
format_list_bulleted
Question

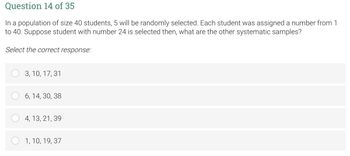
Transcribed Image Text:Question 14 of 35
In a population of size 40 students, 5 will be randomly selected. Each student was assigned a number from 1
to 40. Suppose student with number 24 is selected then, what are the other systematic samples?
Select the correct response:
3, 10, 17, 31
6, 14, 30, 38
4, 13, 21, 39
1, 10, 19, 37

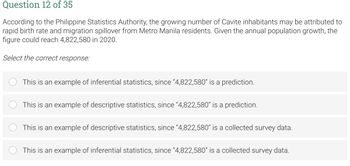
Transcribed Image Text:Question 12 of 35
According to the Philippine Statistics Authority, the growing number of Cavite inhabitants may be attributed to
rapid birth rate and migration spillover from Metro Manila residents. Given the annual population growth, the
figure could reach 4,822,580 in 2020.
Select the correct response:
This is an example of inferential statistics, since "4,822,580" is a prediction.
This is an example of descriptive statistics, since "4,822,580" is a prediction.
This is an example of descriptive statistics, since "4,822,580" is a collected survey data.
This is an example of inferential statistics, since "4,822,580" is a collected survey data.
Expert Solution
This question has been solved!
Explore an expertly crafted, step-by-step solution for a thorough understanding of key concepts.
Step by stepSolved in 2 steps with 1 images

Knowledge Booster
Similar questions
- We wish to gather some information relating to the average time a hospitalized Eagle Flu patient remains in the hospital. We randomly sample 16 cured formerly hospitalized Eagle Flu patients and these were the number of days spent in the hospital: 6.09, 8.04, 6.43, 8.58, 10.34, 5.40, 9.87, 9.24, 9.18, 5.06, 5.39, 5.89, 11.91, 8.94, 5.68, 9.85Many surveys of flu hospital stays show that hospitalization length is normally distributed. So, we assume that our sample comes from a normal population with unknown mean of μ days and an unknown standard deviation of σ days. We would like to test whether the average hospital stay length is less than 8.1 days..The null hypothesis is thus H0:μ=8.1 . We will test this against the alternative Ha We want to test at the 8% level.Let x = the sample mean and s = the sample standard deviation.f) Calculate the critical value, tstar, for your test.(negative value)arrow_forwardSuppose you are the president of the student government. You wish to conduct a survey to determine the student body's opinion regarding student services. The administration provides you with a list of the names and phone numbers of 5,412 registered student. Discuss the procedure you would follow to obtain a systematic random sample of 100 students.arrow_forwardIn a study with 5 groups, 6 samples each group, what are the degrees of freedom for the total, group, and error, respectively? a. 29, 5, 25 b. 29, 25, 4 c. 29, 5, 24 d. 29, 4, 25arrow_forward
- In selecting a sample, if you were to obtain a systematic sample of 40 from a population of 600, and your randomly selected starting point is 12, your next three selections should be: a. 24, 36, 48 b. 27, 42, 57 c. 42,92, 137 d. 90, 140, 190arrow_forwardConsider the population consisting of {4,5,9}. If samples of size n = 2 are randomly selected from the population with replacement compute the mean of the sample medians Multiple choice answers 5 6 7 4 5.5arrow_forwardtable 1 gives flight arrival numbers from a random sample of flights for airlines. Airline 1 early =133 on-time = 416+ late =150 total 699.. Airline 2 early =58 on-time =354 late =87 total =499. total early = 191 on-time =770 late =237 overall total =1198 . Test whether there is a difference between the two airlines in the percent of flights that arrive late. FIND THE RELEVANT SAMPLE PROPORTIONS IN EACH GROUP AND THE POOLED PROPORTION. P HAT 1= ? P HAT 2= ? P HAT = ? STATE THE NULL AND THE ALTERNATIVE HYPOTHESES? GIVE THE TEST STATISTIC AND THE P-VALUE?…arrow_forward
- 2. In a population it is estimated that 20% have a desired trait of interest for the researcher. The researcher wants to know how many people on average he has to draw from a population to get 2 people with the trait. Use rows 20-24 of the Random Number Table to carry out the simulation. Explain clearly how you set up the problem and report your findings. Answer:arrow_forwardConsider the following random sample of data: -7, 5, -1, -1, 8, 1, 7, -4, 8, 80 a) What is the mean of the sample data? Round your response to at least 2 decimal places. Number b) If the outlier is removed, what is the mean of the remaining sample data? Round your response to at least 2 decimal places. Numberarrow_forwardImagine a researcher asks a sample of five people to drive two types of cars and rate each of them on a scale of 1 to 25. The researcher wants to know: Is there is a difference in the ratings of the two types of cars. Below are the data collected: Type A: 20, 10, 11, 23, 7 Type B: 10, 11, 4, 12, 1 what type of T Test would be appropriatearrow_forward
arrow_back_ios
arrow_forward_ios
Recommended textbooks for you
 MATLAB: An Introduction with ApplicationsStatisticsISBN:9781119256830Author:Amos GilatPublisher:John Wiley & Sons Inc
 Probability and Statistics for Engineering and th...StatisticsISBN:9781305251809Author:Jay L. DevorePublisher:Cengage Learning
 Statistics for The Behavioral Sciences (MindTap C...StatisticsISBN:9781305504912Author:Frederick J Gravetter, Larry B. WallnauPublisher:Cengage Learning
 Elementary Statistics: Picturing the World (7th E...StatisticsISBN:9780134683416Author:Ron Larson, Betsy FarberPublisher:PEARSON
 The Basic Practice of StatisticsStatisticsISBN:9781319042578Author:David S. Moore, William I. Notz, Michael A. FlignerPublisher:W. H. Freeman
 Introduction to the Practice of StatisticsStatisticsISBN:9781319013387Author:David S. Moore, George P. McCabe, Bruce A. CraigPublisher:W. H. Freeman

MATLAB: An Introduction with Applications
Statistics
ISBN:9781119256830
Author:Amos Gilat
Publisher:John Wiley & Sons Inc

Probability and Statistics for Engineering and th...
Statistics
ISBN:9781305251809
Author:Jay L. Devore
Publisher:Cengage Learning

Statistics for The Behavioral Sciences (MindTap C...
Statistics
ISBN:9781305504912
Author:Frederick J Gravetter, Larry B. Wallnau
Publisher:Cengage Learning

Elementary Statistics: Picturing the World (7th E...
Statistics
ISBN:9780134683416
Author:Ron Larson, Betsy Farber
Publisher:PEARSON

The Basic Practice of Statistics
Statistics
ISBN:9781319042578
Author:David S. Moore, William I. Notz, Michael A. Fligner
Publisher:W. H. Freeman

Introduction to the Practice of Statistics
Statistics
ISBN:9781319013387
Author:David S. Moore, George P. McCabe, Bruce A. Craig
Publisher:W. H. Freeman