
MATLAB: An Introduction with Applications
6th Edition
ISBN: 9781119256830
Author: Amos Gilat
Publisher: John Wiley & Sons Inc
expand_more
expand_more
format_list_bulleted
Related questions
Question
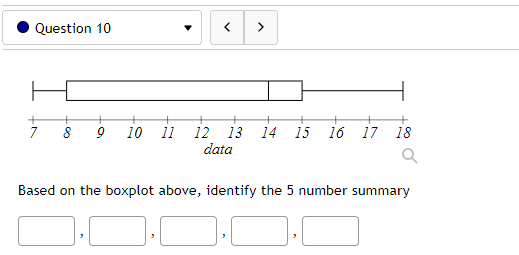

Transcribed Image Text:Question 10
Co
O
+
+
+
10 11 12 13 14 15 16 17 18
data
Based on the boxplot above, identify the 5 number summary
Expert Solution
This question has been solved!
Explore an expertly crafted, step-by-step solution for a thorough understanding of key concepts.

Step by stepSolved in 3 steps with 2 images

Knowledge Booster

Similar questions
- P 5 6 7 8 9 10 11 12 13 14 15 16 17 18 19 data Q Based on the boxplot above, identify the 5 number summaryarrow_forwardfor the following data 1.3, 1.7, 2.1, 2.5, 2.8, 3.7, 3.7, 4.1, 4.3, 4.4, 5.5 find the five number summaryarrow_forwardThe owners of an amusement park count the number of adults and children who attend the park on a Friday and Saturday. The completed table is shown below. Friday Saturday Total Adults 245 371 616 Children 154 277 431 Total 399 648 1,047 How does the joint frequency for the number of adults who attended the amusement park on Friday compare to the joint frequency for the number of children who attended the amusement park on Saturday? The joint frequency for the number of adults who attended the amusement park on Friday is 399, which is less than the joint frequency for the number of children who attended the amusement park on Saturday, 431. The joint frequency for the number of adults who attended the amusement park on Friday is 154, which is less than the joint frequency for the number of children who attended the amusement park on Saturday, 277. The joint frequency for the number of adults who attended the amusement park on Friday is 371, which is…arrow_forward
- Researchers wanted to know the effectiveness of a new allergy medicine. A study was conducted on 500 adults who experience allergy symptoms. Each adult was randomly assigned to receive the new allergy medicine or a placebo. Researchers recorded whether or not their symptoms improved within 1 week. a. Complete the two-way table summarizing the findings. Allergy Medicine Placebo Total Symptoms Improved 85 80 Symptoms DidNot Improve Total 215 285 500 b. Use the study results to complete the following. Round your answer to the nearest tenth of a percent, as needed. Notice the percent sign is already included, so you just need to type the number. What percent of the adults in this study were given the new allergy medicine? % What percent of those who experienced improvements received the allergy medicine? % What percent of those who received the allergy medicine experienced improvements? % What percent of those who did not received the allergy…arrow_forwardWhat is the 5 summaries?arrow_forwardPlease solve complete in one hourarrow_forward
- The data show the sizes in square miles of notable islands in the Baltic Sea and the Aleutian Islands. Baltic Sea Aleutian Islands 600 266 224 1049 1151 1562 1149 678 2767 347 402 434 (a)Draw the boxplot for the given data for the Baltic Sea. Round your answers to the nearest ten. 050010001500200025003000Baltic Sea (only 5 numbers can be in the boxplot)arrow_forward25arrow_forwardIn a study conducted by a human resource management organization, 492 human resource professionals were surveyed. Of those surveyed, 83% said that their companies conduct criminal background checks on all job applicants. Complete parts (a) through (d). Question content area bottom Part 1a. What is the exact value that is 83% of 492 survey subjects?arrow_forward
- 4. Trying to determine the number of students to accept is a tricky task for universities. The Admissions staff at a small private college wants to use data from the past few years to predict the number of students enrolling in the university from those who are accepted by the university. R INPUT: accepted |t]) (Intercept) accepted 88.88272 182.36584 0.487 0.6515 0.20801 0.07002 2.971 0.0411 * Signif. codes: ***' 0.001 **' 0.01 '*' 0.05 '.' 0.1 ' 1 Residual standard error: 26.35 on 4 degrees of freedom 0.6881, Adjusted R-squared: 0.6101 Multiple R-squared: F-statistic: 8.824 on 1 and 4 DF, p-value: 0.04112 (a) Write an equation for the regression line. (b) What is the slope of the least-squares regression line? Interpret this in the context of the application. (c) Interpret the intercept of the line in context. Does the interpretation make sense?arrow_forwardCan someone please help? Thank you.arrow_forwardA pollster wants to minimize the effect the order of the questions has on a person's response to a survey. How many different surveys are required to cover all possible arrangements if there are 12 questions on the survey? Question content area bottom Part 1 A.39 comma 916 comma 800 39,916,800 B.479 comma 001 comma 600 479,001,600 C.144 144 D.12 12arrow_forward
arrow_back_ios
SEE MORE QUESTIONS
arrow_forward_ios
Recommended textbooks for you
- MATLAB: An Introduction with ApplicationsStatisticsISBN:9781119256830Author:Amos GilatPublisher:John Wiley & Sons Inc
 Probability and Statistics for Engineering and th...StatisticsISBN:9781305251809Author:Jay L. DevorePublisher:Cengage Learning
 Statistics for The Behavioral Sciences (MindTap C...StatisticsISBN:9781305504912Author:Frederick J Gravetter, Larry B. WallnauPublisher:Cengage Learning
  Elementary Statistics: Picturing the World (7th E...StatisticsISBN:9780134683416Author:Ron Larson, Betsy FarberPublisher:PEARSON
 The Basic Practice of StatisticsStatisticsISBN:9781319042578Author:David S. Moore, William I. Notz, Michael A. FlignerPublisher:W. H. Freeman
 Introduction to the Practice of StatisticsStatisticsISBN:9781319013387Author:David S. Moore, George P. McCabe, Bruce A. CraigPublisher:W. H. Freeman
MATLAB: An Introduction with Applications
Statistics
ISBN:9781119256830
Author:Amos Gilat
Publisher:John Wiley & Sons Inc
Probability and Statistics for Engineering and th...
Statistics
ISBN:9781305251809
Author:Jay L. Devore
Publisher:Cengage Learning
Statistics for The Behavioral Sciences (MindTap C...
Statistics
ISBN:9781305504912
Author:Frederick J Gravetter, Larry B. Wallnau
Publisher:Cengage Learning
Elementary Statistics: Picturing the World (7th E...
Statistics
ISBN:9780134683416
Author:Ron Larson, Betsy Farber
Publisher:PEARSON
The Basic Practice of Statistics
Statistics
ISBN:9781319042578
Author:David S. Moore, William I. Notz, Michael A. Fligner
Publisher:W. H. Freeman
Introduction to the Practice of Statistics
Statistics
ISBN:9781319013387
Author:David S. Moore, George P. McCabe, Bruce A. Craig
Publisher:W. H. Freeman