MATLAB: An Introduction with Applications
6th Edition
ISBN: 9781119256830
Author: Amos Gilat
Publisher: John Wiley & Sons Inc
expand_more
expand_more
format_list_bulleted
Question

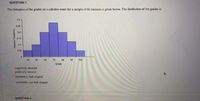
Transcribed Image Text:QUESTION 1
The histogram of the grades on a calculus exam for a sample of 40 students is given below. The distibution of the grades is
025
02
0.15
01
0.05
60
70
60
90
100
Grade
negatively skewed
positively skewed
symmetric, bell-shaped
symmetric, not bell-shaped
QUESTION 2
Retale Frequency
000
Expert Solution
This question has been solved!
Explore an expertly crafted, step-by-step solution for a thorough understanding of key concepts.
Step by stepSolved in 2 steps with 1 images

Knowledge Booster
Similar questions
- QUESTION 13 Eighty hamsters were trained to run a maze. The frequency distribution below presents the number of trials it took each hamster to successfully complete the maze. # of Trials 1 2 3 5 6 7 10 Frequency 5 5 11 13 12 19 Make a histogram for this frequency distribution by hand and attach your file as a pdf, jpg, or png.arrow_forwardQuestion 15arrow_forwardQuestion 5 The mean height of an adult giraffe is 19 feet. Suppose that the distribution is normally distributed with standard deviation 0.8 feet. Let X be the height of a randomly selected adult giraffe. Round all answers to 4 decimal places where possible. a. What is the distribution of X? X N( b. What is the median giraffe height? ft. c. What is the Z-score for a giraffe that is 22 foot tall? d. What is the probability that a randomly selected giraffe will be shorter than 19.4 feet tall? e. What is the probability that a randomly selected giraffe will be between 18 and 18.8 feet tall? ft. f. The 85th percentile for the height of giraffes is Hint: Helpful videos: • Find a Probability [+] Finding a Value Given a Probability [+] Hint Question Help: Message instructor Submit Questionarrow_forward
- Question 2 The Z- scores of an accepted range of Pizza Pockets is between -1.10 and 0.51. If there are 250 000 pizza pockets made, how many of those Pizza Pockets will be rejected?arrow_forwardQuestion 7 Test scores were recorded for students in a statistics class. The scores for the first test had a standard deviation of 3.8 points. The scores from the second test had a standard deviation of 4.8 points. Choose the correct statement below. O The average test grade rose by 1 point. O The higher standard deviation of the second test indicates higher average scores on the second test than on the first test. O The scores of the second test were closer together than the first test. O The scores of the first test were closer together than the second test. O None of the above statements are true. 1 ptsarrow_forwardQuestion 2 of 10 To estimate the mean height of female high school juniors, you take a random sample of 30 female students and get these results (in inches): 72, 51, 67, 68, 61, 69, 58, 56, 60, 56 66, 61, 60, 59, 59, 54, 58, 53, 68, 63 57, 62, 63, 64, 56, 62, 58, 67, 57, 70 If the o is 5.3, based on past research, and you want to construct a 97% confidence interval using (estimate) ± (margin of error)= (estimate) ± z* what's your value for z*? O A. 1.645 В. 2.17 О с. 1.96 D. 2.576 O E. 1.88arrow_forward
- Question 6 Find the sample proportion, p-hat. When 410 college students were surveyed,150 said they own their car. Find a point estimate for p (p-hat), the population proportion of students who own their cars. O 0.366 O 0.634 O 0.268 O 0.577arrow_forwardQUESTION 4 Below are results from some survey. The values are 34,23,42,37,38,23 and 33. (a) Find the mean. (b) Calculate the standard deviation.arrow_forward
arrow_back_ios
arrow_forward_ios
Recommended textbooks for you
 MATLAB: An Introduction with ApplicationsStatisticsISBN:9781119256830Author:Amos GilatPublisher:John Wiley & Sons Inc
 Probability and Statistics for Engineering and th...StatisticsISBN:9781305251809Author:Jay L. DevorePublisher:Cengage Learning
 Statistics for The Behavioral Sciences (MindTap C...StatisticsISBN:9781305504912Author:Frederick J Gravetter, Larry B. WallnauPublisher:Cengage Learning
 Elementary Statistics: Picturing the World (7th E...StatisticsISBN:9780134683416Author:Ron Larson, Betsy FarberPublisher:PEARSON
 The Basic Practice of StatisticsStatisticsISBN:9781319042578Author:David S. Moore, William I. Notz, Michael A. FlignerPublisher:W. H. Freeman
 Introduction to the Practice of StatisticsStatisticsISBN:9781319013387Author:David S. Moore, George P. McCabe, Bruce A. CraigPublisher:W. H. Freeman

MATLAB: An Introduction with Applications
Statistics
ISBN:9781119256830
Author:Amos Gilat
Publisher:John Wiley & Sons Inc

Probability and Statistics for Engineering and th...
Statistics
ISBN:9781305251809
Author:Jay L. Devore
Publisher:Cengage Learning

Statistics for The Behavioral Sciences (MindTap C...
Statistics
ISBN:9781305504912
Author:Frederick J Gravetter, Larry B. Wallnau
Publisher:Cengage Learning

Elementary Statistics: Picturing the World (7th E...
Statistics
ISBN:9780134683416
Author:Ron Larson, Betsy Farber
Publisher:PEARSON

The Basic Practice of Statistics
Statistics
ISBN:9781319042578
Author:David S. Moore, William I. Notz, Michael A. Fligner
Publisher:W. H. Freeman

Introduction to the Practice of Statistics
Statistics
ISBN:9781319013387
Author:David S. Moore, George P. McCabe, Bruce A. Craig
Publisher:W. H. Freeman