
MATLAB: An Introduction with Applications
6th Edition
ISBN: 9781119256830
Author: Amos Gilat
Publisher: John Wiley & Sons Inc
expand_more
expand_more
format_list_bulleted
Related questions
Concept explainers
Topic Video
Question
Answer only 1(c)
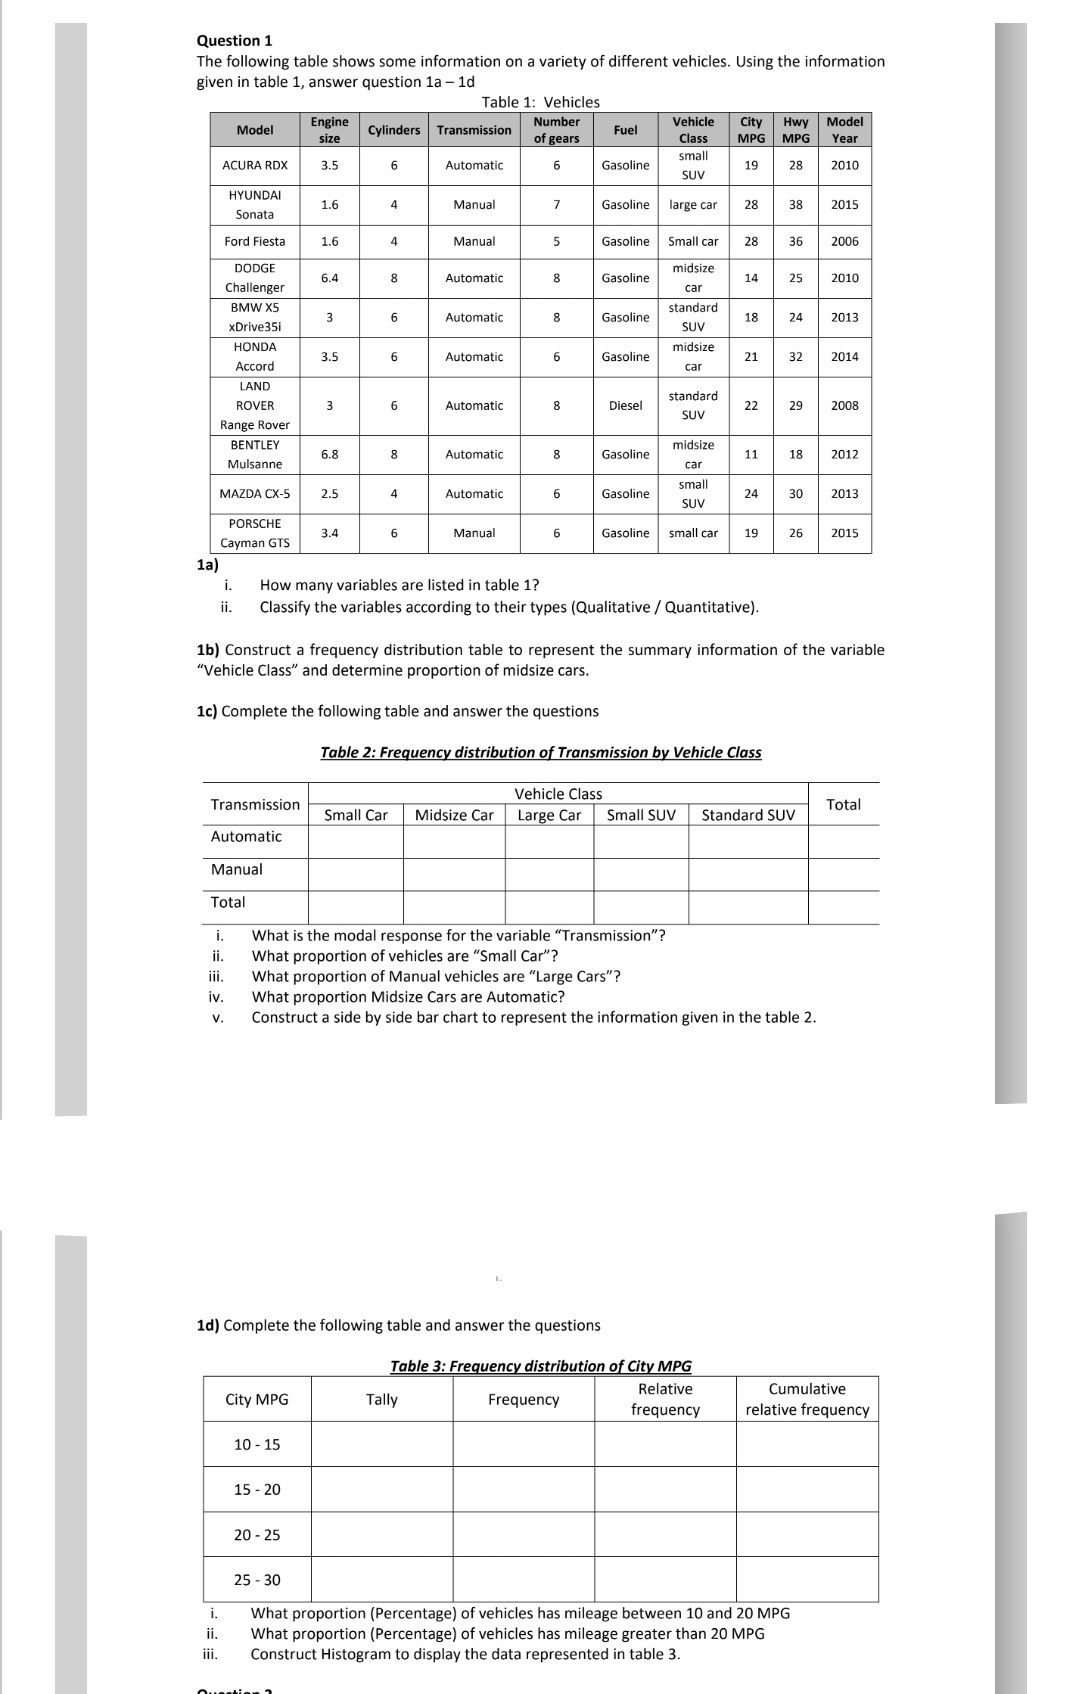

Transcribed Image Text:Question 1
The following table shows some information on a variety of different vehicles. Using the information
given in table 1, answer question la – 1d
Table 1: Vehicles
Engine
Number
Vehicle
Model
City
Hwy
MPG MPG
Model
Cylinders Transmission
Fuel
size
of gears
Class
Year
small
ACURA RDX
3.5
Automatic
6
Gasoline
19
28
2010
SUV
HYUNDAI
1.6
4
Manual
7
Gasoline
large car
28
38
2015
Sonata
Ford Fiesta
1.6
Manual
Gasoline
Small car
28
36
2006
DODGE
midsize
6.4
Automatic
Gasoline
14
25
2010
Challenger
car
BMW X5
standard
3
6
Automatic
8
Gasoline
18
24
2013
xDrive35i
SUV
HONDA
midsize
3.5
Automatic
6
Gasoline
21
32
2014
Accord
car
LAND
standard
ROVER
3
6.
Automatic
8
Diesel
22
29
2008
SUV
Range Rover
BENTLEY
midsize
6.8
Automatic
8
Gasoline
11
18
2012
Mulsanne
car
small
MAZDA CX-5
2.5
4
Automatic
Gasoline
24
30
2013
SUV
PORSCHE
3.4
6
Manual
Gasoline
small car
19
26
2015
Cayman GTS
1a)
i.
How many variables are listed in table 1?
ii.
Classify the variables according to their types (Qualitative / Quantitative).
1b) Construct a frequency distribution table to represent the summary information of the variable
"Vehicle Class" and determine proportion of midsize cars.
1c) Complete the following table and answer the questions
Table 2: Frequency distribution of Transmission by Vehicle Class
Vehicle Class
Transmission
Total
Small Car
Midsize Car
Large Car
Small SUV
Standard SUV
Automatic
Manual
Total
What is the modal response for the variable "Transmission"?
What proportion of vehicles are "Small Car"?
What proportion of Manual vehicles are "Large Cars"?
What proportion Midsize Cars are Automatic?
Construct a side by side bar chart to represent the information given in the table 2.
i.
ji.
i.
iv.
V.
1d) Complete the following table and answer the questions
Table 3: Frequency distribution of City MPG
Relative
Cumulative
City MPG
Tally
Frequency
frequency
relative frequency
10 - 15
15 - 20
20 - 25
25 - 30
i.
What proportion (Percentage) of vehicles has mileage between 10 and 20 MPG
What proportion (Percentage) of vehicles has mileage greater than 20 MPG
Construct Histogram to display the data represented in table 3.
ii.
ii.
Ouestien 1
Expert Solution
This question has been solved!
Explore an expertly crafted, step-by-step solution for a thorough understanding of key concepts.

This is a popular solution

Trending nowThis is a popular solution!

Step by stepSolved in 5 steps with 2 images

Knowledge Booster


Learn more about
Need a deep-dive on the concept behind this application? Look no further. Learn more about this topic, statistics and related others by exploring similar questions and additional content below.Similar questions
- d. Is {0} € {{0}, {1}}? Answer:arrow_forwardIn a study of high school students at least 16 years of age, researchers obtained survey results summarized in the accompanying table. Use a 0.05 significance level to test the claim of independence between texting while driving and driving when drinking alcohol. Are those two risky behaviors independent of each other? Click the icon to view the table of survey results. Determine the null and alternative hypotheses. Ho: H₁: Determine the test statistic. x² = (Round to two decimal places as needed.) Determine the P-value of the test statistic. P-value = (Round to three decimal places as needed.) Do the results suggest that texting while driving and driving while drinking are related? O A. Reject the null hypothesis. There is sufficient evidence at a 0.05 significance level to warrant rejection of the claim of independence between texting while driving and driving while drinking alcohol. Those two risky behaviors appear to be somehow related. B. Reject the null hypothesis. There is…arrow_forwardLisa has 120 sweets. She gives (5)/(12) of them to her brother. How many sweets does Lisa have left? Pls give answer in text.arrow_forward
arrow_back_ios
arrow_forward_ios
Recommended textbooks for you
- MATLAB: An Introduction with ApplicationsStatisticsISBN:9781119256830Author:Amos GilatPublisher:John Wiley & Sons Inc
 Probability and Statistics for Engineering and th...StatisticsISBN:9781305251809Author:Jay L. DevorePublisher:Cengage Learning
 Statistics for The Behavioral Sciences (MindTap C...StatisticsISBN:9781305504912Author:Frederick J Gravetter, Larry B. WallnauPublisher:Cengage Learning
  Elementary Statistics: Picturing the World (7th E...StatisticsISBN:9780134683416Author:Ron Larson, Betsy FarberPublisher:PEARSON
 The Basic Practice of StatisticsStatisticsISBN:9781319042578Author:David S. Moore, William I. Notz, Michael A. FlignerPublisher:W. H. Freeman
 Introduction to the Practice of StatisticsStatisticsISBN:9781319013387Author:David S. Moore, George P. McCabe, Bruce A. CraigPublisher:W. H. Freeman
MATLAB: An Introduction with Applications
Statistics
ISBN:9781119256830
Author:Amos Gilat
Publisher:John Wiley & Sons Inc
Probability and Statistics for Engineering and th...
Statistics
ISBN:9781305251809
Author:Jay L. Devore
Publisher:Cengage Learning
Statistics for The Behavioral Sciences (MindTap C...
Statistics
ISBN:9781305504912
Author:Frederick J Gravetter, Larry B. Wallnau
Publisher:Cengage Learning
Elementary Statistics: Picturing the World (7th E...
Statistics
ISBN:9780134683416
Author:Ron Larson, Betsy Farber
Publisher:PEARSON
The Basic Practice of Statistics
Statistics
ISBN:9781319042578
Author:David S. Moore, William I. Notz, Michael A. Fligner
Publisher:W. H. Freeman
Introduction to the Practice of Statistics
Statistics
ISBN:9781319013387
Author:David S. Moore, George P. McCabe, Bruce A. Craig
Publisher:W. H. Freeman