
ENGR.ECONOMIC ANALYSIS
14th Edition
ISBN: 9780190931919
Author: NEWNAN
Publisher: Oxford University Press
expand_more
expand_more
format_list_bulleted
Related questions
Question

Transcribed Image Text:QUESTION 1
Table 13-16
Average
Variable Marginal
Average
Variable
Average
Total
Fixed
Quantity Total Cost Fixed Cost
Cost
Cost
Cost
Cost
Cost
$24
1.
S16
2.
50
3
S108
$40
4.
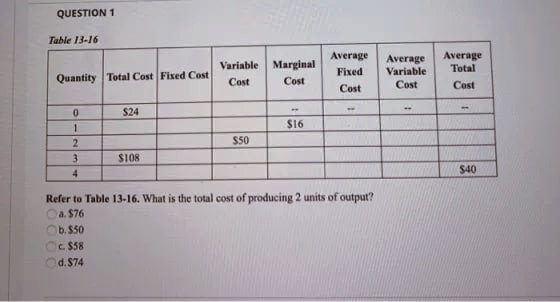
Refer to Table 13-16. What is the total cost of producing 2 units of output?
Oa. $76
Ob. $50
C. $58
d.$74
Expert Solution
This question has been solved!
Explore an expertly crafted, step-by-step solution for a thorough understanding of key concepts.

This is a popular solution

Trending nowThis is a popular solution!

Step by stepSolved in 2 steps

Knowledge Booster


Learn more about
Need a deep-dive on the concept behind this application? Look no further. Learn more about this topic, economics and related others by exploring similar questions and additional content below.Similar questions
- 10.Which of the following is an example of a fixed cost? A. cost of employees who work overtime B. cost of machinery C. cost of flour at a bakery D. cost of employees who work standard hoursarrow_forwardPlease no written by hand Acme, Inc. is currently producing 12,000 gadgets per year. Acme’s average total cost (ATC) is $18 per year. What is Acme’s total cost (TC) per year? a. $667 b. $108,000 c. $216,000 d. $500 e. $1500arrow_forwardQUESTION 1 Table 13-16 Average Average Variable Marginal Fixed Variable Quantity Total Cost Fixed Cost Cost Cost Cost Cost - $24 - -- 0 1 $16 2 $50 3 $108 4 Refer to Table 13-16. What is the total cost of producing 2 units of output? Ca. $76 b. $50 c. $58 d. $74 Average Total Cost $40arrow_forward
- Please answer the correct answer ASAP please Don't answer by pen paper please calculation correctarrow_forwardB. the rodu g one m Average Variable Cost C. fixed costs divided by output D. total cost divided by output v Marginal Cost QUESTION 5 20 points Save Answer Match each of the following terms and descriptions Constant returns to scale when the average cost of producing each individual unit A. declines as total output increases Diseconomies of scale average cost of producing each individual item increases as В. output increases economies of scale average cost of producing each individual unit remains C. constant as output increases Long Run Average Total Cost Curve the relationship between output and costs over the life of a D. business Click Save and Submit to save and submit. Click Save All Answers to save all answers. Save All Answers Save and Submit ype here to search W 63°F Ca ) ENG 8:10 PM 10/18/2021 hparrow_forward4.The Marginal Cost Curve is shaped like a Nike swoosh. graph. 5.The Marginal Cost Curve crosses the Average Total Cost curve and Average Variable Cost curves at the lowest point. graph.arrow_forward
- Use the following information: Cost Volume $15,000 3,000 $18,000 4,000 $20,000 7,000 The fixed cost element for the firm is a. $11,250 b. $10,250 c. $12,250 d. $11,350arrow_forwardCosts and Profit Maximization: Work It Out 1 Suppose Margie decides to lease a photocopier and open up a black-and-white photocopying service in her dorm room for use by faculty and students. Her total cost, as a function of the number of copies she produces per month, is given in the table. Number of Photocopies Per Month Total Cost Fixed Cost Variable Cost Total Revenue Profit 0 $100 1,000 $110 2,000 $125 3,000 $145 4,000 $175 5,000 $215 6,000 $285 a. Fill in the missing numbers in the table, assuming that Margie can charge 6 cents per black-and-white copy. Margie's fixed cost is: $ Variable cost, 0 photocopies/month: $ Variable cost, 1,000 photocopies/month: $ Variable cost, 2,000 photocopies/month: $ Variable cost, 3,000 photocopies/month: $ Variable cost, 4,000 photocopies/month: $…arrow_forward1. Explain the difference between explicit costs and implicit costs. 2. Explain the difference between economic profit and accounting profit. 3. What are the 2 variables that the Production Function is analyzing/graphing? Why does the production function diminish over time? 4. Give an example of a fixed cost and a variable cost. 5. How does fixed costs and variable cost change with increased production? 6. Why does Marginal Cost rise? 7. Why is the Average Total Cost curve U shaped? 8. Why is the Minimum Average Total Cost and Efficient Scale important? 9. What is the relationship between Marginal Cost and Average Total Cost? 10. Explain why economies of scale is important.arrow_forward
- QUESTION 2 Figure and Table: Variable, Fixed, and Total Costs Total cost $2,500 2,000 1,500 1,000 500 Points on Graph A B C E 0 G H I A B₁ Reference: Ref 6-11 с 20 1 1 1 40 60 80 100 Quantity of wheat (bushels) DEFGH Total cost, TC Quantity of Labor (workers), L 0 1 2 3 4 6 8 Quantity of Wheat (bushels), Q 0 PORTARI 19 36 51 64 75 84 91 96 Variable Cost, VC $ 0 200 400 600 800 1,000 1,200 1,400 1,600 Fixed Cost, FC $400 400 400 400 400 400 400 400 400 Total Cost, TC $ FC + VC 400 600 800 1,000 1,200 1,400 1,600 1,800 2,000 (Figure and Table: Variable, Fixed, and Total Costs) The marginal cost of increasing production from 0 to 19 bushels of wheat is: OA. $22.22. B. $11.76. OC. $10.53 D. $11.11. OE. $23.53.arrow_forward1. Your cousin Vinnie owns a painting company with fixed costs of $150 and the following schedule for variable costs: Quantity Variable Cost Average Fixed Cost Average Variable Cost Average Total Cost (Houses Painted per Month) (Dollars) (Dollars) (Dollars) (Dollars) 1 15 2 35 3 60 4 90 5 135 6 240 7 480 The efficient scale is houses. ? #2 image : The city government is considering two tax proposals: • A lump-sum tax of $300 on each producer of hamburgers. • A tax of $1 per burger, paid by producers of hamburgers. Which of the following statements is true as a result of the lump-sum tax? Check all that apply. Which of the following statements is true as a result of the lump-sum tax? Check all that apply. Average variable cost will increase. Average total cost will increase. Average…arrow_forwardUse the graph from class to find 1. Marginal Cost at 100; 2. Total Cost at 100; 3. Variable Cost at 100; 4. Fixed Cost at 100. Construct your own graphs similar to the ones from class. Use your diagram to show . 5. Whether or not reducing the quantity produced will always reduce the total cost. 6. Whether or not reducing the quantity produced will always reduce the average total cost. 7. Whether or not reducing the quantity produced will always reduce the marginal cost. 59 30 10- 5 MC ATC AVC 100 0arrow_forward
arrow_back_ios
SEE MORE QUESTIONS
arrow_forward_ios
Recommended textbooks for you
 Principles of Economics (12th Edition)EconomicsISBN:9780134078779Author:Karl E. Case, Ray C. Fair, Sharon E. OsterPublisher:PEARSON
 Engineering Economy (17th Edition)EconomicsISBN:9780134870069Author:William G. Sullivan, Elin M. Wicks, C. Patrick KoellingPublisher:PEARSON
 Principles of Economics (MindTap Course List)EconomicsISBN:9781305585126Author:N. Gregory MankiwPublisher:Cengage Learning
 Managerial Economics: A Problem Solving ApproachEconomicsISBN:9781337106665Author:Luke M. Froeb, Brian T. McCann, Michael R. Ward, Mike ShorPublisher:Cengage Learning
 Managerial Economics & Business Strategy (Mcgraw-...EconomicsISBN:9781259290619Author:Michael Baye, Jeff PrincePublisher:McGraw-Hill Education
Principles of Economics (12th Edition)
Economics
ISBN:9780134078779
Author:Karl E. Case, Ray C. Fair, Sharon E. Oster
Publisher:PEARSON
Engineering Economy (17th Edition)
Economics
ISBN:9780134870069
Author:William G. Sullivan, Elin M. Wicks, C. Patrick Koelling
Publisher:PEARSON
Principles of Economics (MindTap Course List)
Economics
ISBN:9781305585126
Author:N. Gregory Mankiw
Publisher:Cengage Learning
Managerial Economics: A Problem Solving Approach
Economics
ISBN:9781337106665
Author:Luke M. Froeb, Brian T. McCann, Michael R. Ward, Mike Shor
Publisher:Cengage Learning
Managerial Economics & Business Strategy (Mcgraw-...
Economics
ISBN:9781259290619
Author:Michael Baye, Jeff Prince
Publisher:McGraw-Hill Education