MATLAB: An Introduction with Applications
6th Edition
ISBN: 9781119256830
Author: Amos Gilat
Publisher: John Wiley & Sons Inc
expand_more
expand_more
format_list_bulleted
Question
Q1

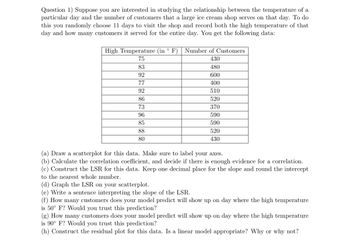
Transcribed Image Text:Question 1) Suppose you are interested in studying the relationship between the temperature of a
particular day and the number of customers that a large ice cream shop serves on that day. To do
this you randomly choose 11 days to visit the shop and record both the high temperature of that
day and how many customers it served for the entire day. You get the following data:
High Temperature (in ° F)
75
83
92
77
92
86
73
96
85
88
80
Number of Customers
430
480
600
400
510
520
370
590
590
520
430
(a) Draw a scatterplot for this data. Make sure to label your axes.
(b) Calculate the correlation coefficient, and decide if there is enough evidence for a correlation.
(c) Construct the LSR for this data. Keep one decimal place for the slope and round the intercept
to the nearest whole number.
(d) Graph the LSR on your scatterplot.
(e) Write a sentence interpreting the slope of the LSR.
(f) How many customers does your model predict will show up on day where the high temperature
is 50° F? Would you trust this prediction?
(g) How many customers does your model predict will show up on day where the high temperature
is 90° F? Would you trust this prediction?
(h) Construct the residual plot for this data. Is a linear model appropriate? Why or why not?
Expert Solution
This question has been solved!
Explore an expertly crafted, step-by-step solution for a thorough understanding of key concepts.
This is a popular solution
Step 1: Write the given information.
VIEW Step 2: Construct the scatter plot for the given data set.
VIEW Step 3: Determine the correlation coefficient for the given data set.
VIEW Step 4: Perform the hypothesis test for the significance of the correlation coefficient.
VIEW Step 5: Determine the least square estimator regression line for the given data.
VIEW Step 6: Graph the least square estimator regression line on the scatterplot and interpret the slope.
VIEW Step 7: Predict the number of costumers using our model for the given high temperature.
VIEW Step 8: Determine the residuals and construct the residual plot.
VIEW Solution
VIEW Trending nowThis is a popular solution!
Step by stepSolved in 9 steps with 33 images

Knowledge Booster
Similar questions
Recommended textbooks for you
 MATLAB: An Introduction with ApplicationsStatisticsISBN:9781119256830Author:Amos GilatPublisher:John Wiley & Sons Inc
 Probability and Statistics for Engineering and th...StatisticsISBN:9781305251809Author:Jay L. DevorePublisher:Cengage Learning
 Statistics for The Behavioral Sciences (MindTap C...StatisticsISBN:9781305504912Author:Frederick J Gravetter, Larry B. WallnauPublisher:Cengage Learning
 Elementary Statistics: Picturing the World (7th E...StatisticsISBN:9780134683416Author:Ron Larson, Betsy FarberPublisher:PEARSON
 The Basic Practice of StatisticsStatisticsISBN:9781319042578Author:David S. Moore, William I. Notz, Michael A. FlignerPublisher:W. H. Freeman
 Introduction to the Practice of StatisticsStatisticsISBN:9781319013387Author:David S. Moore, George P. McCabe, Bruce A. CraigPublisher:W. H. Freeman

MATLAB: An Introduction with Applications
Statistics
ISBN:9781119256830
Author:Amos Gilat
Publisher:John Wiley & Sons Inc

Probability and Statistics for Engineering and th...
Statistics
ISBN:9781305251809
Author:Jay L. Devore
Publisher:Cengage Learning

Statistics for The Behavioral Sciences (MindTap C...
Statistics
ISBN:9781305504912
Author:Frederick J Gravetter, Larry B. Wallnau
Publisher:Cengage Learning

Elementary Statistics: Picturing the World (7th E...
Statistics
ISBN:9780134683416
Author:Ron Larson, Betsy Farber
Publisher:PEARSON

The Basic Practice of Statistics
Statistics
ISBN:9781319042578
Author:David S. Moore, William I. Notz, Michael A. Fligner
Publisher:W. H. Freeman

Introduction to the Practice of Statistics
Statistics
ISBN:9781319013387
Author:David S. Moore, George P. McCabe, Bruce A. Craig
Publisher:W. H. Freeman