
FINANCIAL ACCOUNTING
10th Edition
ISBN: 9781259964947
Author: Libby
Publisher: MCG
expand_more
expand_more
format_list_bulleted
Related questions
Question
Sanj
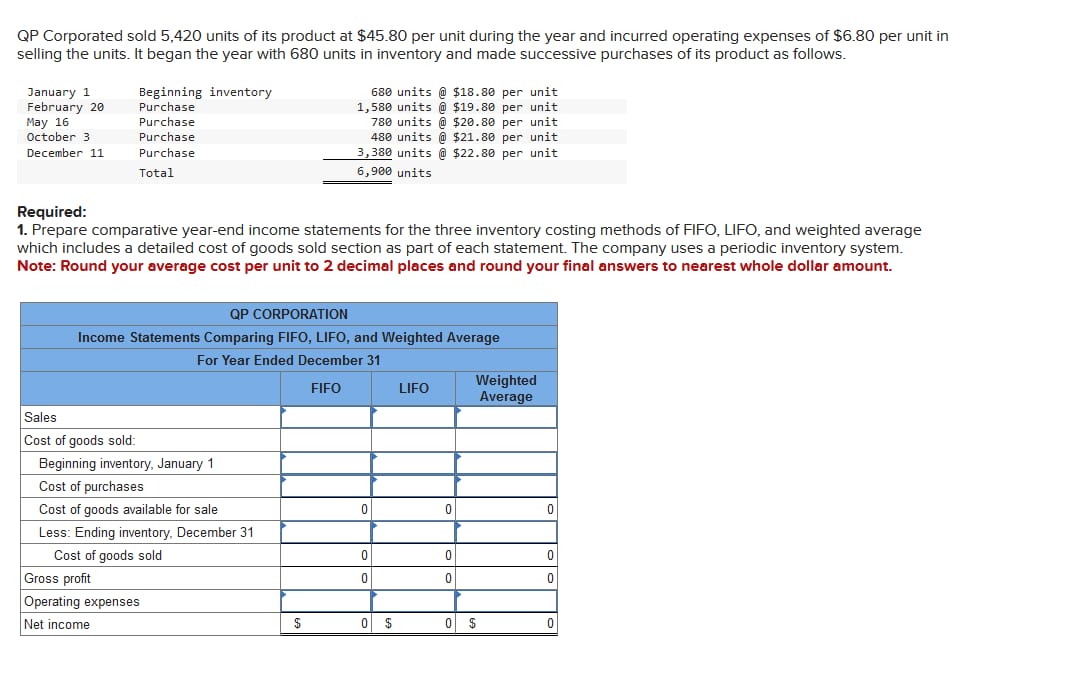

Transcribed Image Text:QP Corporated sold 5,420 units of its product at $45.80 per unit during the year and incurred operating expenses of $6.80 per unit in
selling the units. It began the year with 680 units in inventory and made successive purchases of its product as follows.
January 1
February 20
May 16
October 3
December 11
Beginning inventory
Purchase
Purchase
Purchase
Purchase
Total
Required:
1. Prepare comparative year-end income statements for the three inventory costing methods of FIFO, LIFO, and weighted average
which includes a detailed cost of goods sold section as part of each statement. The company uses a periodic inventory system.
Note: Round your average cost per unit to 2 decimal places and round your final answers to nearest whole dollar amount.
QP CORPORATION
Income Statements Comparing FIFO, LIFO, and Weighted Average
For Year Ended December 31
FIFO
Sales
Cost of goods sold:
Beginning inventory, January 1
Cost of purchases
Cost of goods available for sale
Less: Ending inventory, December 31
Cost of goods sold
680 units @ $18.80 per unit.
1,580 units @ $19.80 per unit
780 units @ $20.80 per unit
480 units @ $21.80 per unit
3,380 units@ $22.80 per unit
6,900 units
Gross profit
Operating expenses
Net income
$
0
0
0
0 $
LIFO
0
0
0
Weighted
Average
0 $
0
0
0
0
Expert Solution
This question has been solved!
Explore an expertly crafted, step-by-step solution for a thorough understanding of key concepts.

Step by stepSolved in 3 steps

Knowledge Booster


Learn more about
Need a deep-dive on the concept behind this application? Look no further. Learn more about this topic, accounting and related others by exploring similar questions and additional content below.Similar questions
arrow_back_ios
SEE MORE QUESTIONS
arrow_forward_ios
Recommended textbooks for you
 AccountingAccountingISBN:9781337272094Author:WARREN, Carl S., Reeve, James M., Duchac, Jonathan E.Publisher:Cengage Learning,
 Accounting Information SystemsAccountingISBN:9781337619202Author:Hall, James A.Publisher:Cengage Learning,
 Horngren's Cost Accounting: A Managerial Emphasis...AccountingISBN:9780134475585Author:Srikant M. Datar, Madhav V. RajanPublisher:PEARSON
 Intermediate AccountingAccountingISBN:9781259722660Author:J. David Spiceland, Mark W. Nelson, Wayne M ThomasPublisher:McGraw-Hill Education
 Financial and Managerial AccountingAccountingISBN:9781259726705Author:John J Wild, Ken W. Shaw, Barbara Chiappetta Fundamental Accounting PrinciplesPublisher:McGraw-Hill Education
Accounting
Accounting
ISBN:9781337272094
Author:WARREN, Carl S., Reeve, James M., Duchac, Jonathan E.
Publisher:Cengage Learning,
Accounting Information Systems
Accounting
ISBN:9781337619202
Author:Hall, James A.
Publisher:Cengage Learning,
Horngren's Cost Accounting: A Managerial Emphasis...
Accounting
ISBN:9780134475585
Author:Srikant M. Datar, Madhav V. Rajan
Publisher:PEARSON
Intermediate Accounting
Accounting
ISBN:9781259722660
Author:J. David Spiceland, Mark W. Nelson, Wayne M Thomas
Publisher:McGraw-Hill Education
Financial and Managerial Accounting
Accounting
ISBN:9781259726705
Author:John J Wild, Ken W. Shaw, Barbara Chiappetta Fundamental Accounting Principles
Publisher:McGraw-Hill Education