
MATLAB: An Introduction with Applications
6th Edition
ISBN: 9781119256830
Author: Amos Gilat
Publisher: John Wiley & Sons Inc
expand_more
expand_more
format_list_bulleted
Related questions
Topic Video
Question
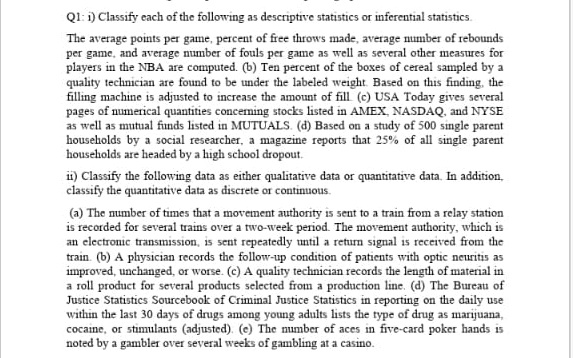

Transcribed Image Text:Q1: i) Classify each of the following as descriptive statistics or inferential statistics.
The average points per game, percent of free throws made, average number of rebounds
per game, and average mumber of fouls per game as well as several other measures for
players in the NBA are computed. (b) Ten percent of the boxes of cereal sampled by a
quality technician are found to be under the labeled weight. Based on this finding, the
filling machine is adjusted to increase the amount of fill (c) USA Today gives several
pages of numerical quantities conceming stocks listed in AMEX, NASDAQ, and NYSE
as well as mutual fiinds listed in MUTUALS. (d) Based on a study of 500 single parent
households by a social researcher, a magazine reports that 25% of all single parent
households are headed by a high school dropout.
i) Classify the following data as either qualitative data or quantitative data. In addition,
classify the quantitative data as discrete or continuous.
(a) The number of times that a movement authority is sent to a train from a relay station
is recorded for several trains over a two-week period. The movement authority, which is
an electronic transmission, is sent repeatedly until a return signal is received from the
train. (b) A physician records the follow-up condition of patients with optic neuritis as
improved, unchanged, or worse. (c) A quality technician records the length of material in
a roll product for several products selected from a production line. (d) The Burcau of
Justice Statistics Sourcebook of Criminal Justice Statistics in reporting on the daily use
within the last 30 days of drugs among young adults lists the type of drug as marijuana,
cocaine, or stimulants (adjusted). (e) The mumber of aces in five-card poker hands is
noted by a gambler over several weeks of gambling at a casino.
Expert Solution
This question has been solved!
Explore an expertly crafted, step-by-step solution for a thorough understanding of key concepts.

This is a popular solution

Trending nowThis is a popular solution!

Step by stepSolved in 2 steps

Knowledge Booster


Learn more about
Need a deep-dive on the concept behind this application? Look no further. Learn more about this topic, statistics and related others by exploring similar questions and additional content below.Similar questions
- The following are average points per game for players on the LA Lakers and Miami Heat during the 2019-2020 season: Lakers (20 values): 0, 1.4, 1.5, 2.8, 4.2, 5.1, 5.3, 5.5, 5.7, 6, 6.6, 7.1, 7.5, 8, 8.6, 9.3, 11.9, 12.8, 25.3, 26.1 Heat (21 values): 0.8, 1, 1.4, 2.4, 3, 3, 4.5, 4.6, 5.7, 6.1, 8.2, 8.5, 9.3, 11.3, 11.9, 13.5, 13.5, 15.3, 15.9, 16.2, 19.9 a) Calculate the five-number summary of each. b) Draw boxplots of each. c) Compare the boxplots – how do they differ?arrow_forwardA local doctors office recorded the wait times for 70 patients on a saturday afternoon and organized he times in the histogram below a. what percent of people waited more than 15 minutes? b. what percent of people waited less than 20 minutes? c. what percent of people waited less than 5 minutes given they waited less than 20 minutes?arrow_forwardListed to the right are the selling prices (in thousands of dollars) for a sample of 19 lakeside lots in Pinnacle Peak, a vacation home community in the Blue Ridge mountains. 86 61 148 81 39 142 140 65 28 85 90 92 25 50 85 85 82 120 137 Determine the following: a. the first quartile b. the third quartile c. the medianarrow_forward
- Joan's Nursery specializes in custom-designed landscaping for residential areas. The estimated labor cost associated with a particular landscaping proposal is based on the number of plantings of trees, shrubs, and so on to be used for the project. For cost-estimating purposes, managers use two hours of labor time for the planting of a medium-sized tree. Actual times from a sample of 10 plantings during the past month follow (times in hours). B, C, and Darrow_forwardIn automobile mileage and gasoline-consumption testing, 13 automobiles were road tested for 300 miles in both city and highway driving conditions. The following data were recorded for miles-per-gallon performance. City: 16.7 17.2 16.4 14.9 13.7 15.8 17.3 16.5 16.6 15.8 15.7 15.8 16.7 Highway: 20.0 21.2 18.9 19.2 19.8 18.0 17.8 19.2 19.6 21.7 20.0 19.1 19.3 Calculate the mean, median, and mode for City and Highway gasoline consumption (to 1 decimal). City Highway Mean Median Mode The data are bimodal: andarrow_forwardData was collected for a sample of organic snacks. The amount of sugar (in mg) in each snack is summarized in the histogram below. Which statement below best describes the meaning of the second bin (or class)? A. There were 65 snacks that contained 2 milligrams of sugar. B. There were 2 snacks that contained between 65 and 70 milligrams of sugar. C. There were 2 snacks that contained 65 milligrams of sugar. D. There were between 65 and 70 snacks that contained 2 milligrams of sugar. E. There were 2 snacks that contained 70 milligrams of sugar. F. There were 70 snacks that contained 2 milligrams of sugar.arrow_forward
- A factory owner has taken a sample (n = 20) of workers to see how many broken widgets each employee produces per day. For the following data, construct a frequency distribution table. Include columns for observed value (Xcat), frequency, proportion, and percent. 2 1 0 2 1 0 7 3 8 0 1 5 0 0 9 2 0 1 3 0arrow_forwardThe densities of several common metals are shown in the following table. Metal Density (g/cm³) iron 7.87 silver 10.49 lead 11.36 zinc 7.13 aluminum 2.70 For her chemistry lab, Kamila needs to identify three metal samples by density. The data she collected is shown in the following table. The metal samples are all rectangular prisms.arrow_forwardBrunt, Rhee, and Zhong (2008) surveyed 557 undergraduate college students to examine their weight status, health behaviors, and diet. Using body mass index (BMI), they classified the students into four categories: underweight, healthy weight, overweight, and obese. They also measured dietary variety by counting the number of different foods each student ate from several food groups. Note that the researchers are not measuring the amount of food eaten, but rather the number of different foods eaten (variety, not quantity). Nonetheless, it was somewhat surprising that the results showed no differences among the four weight categories that were related to eating fatty and/or sugary snacks.Suppose a researcher conducting a follow up study obtains a sample of n = 25 students classified as healthy weight and a sample of n = 36 students classified as overweight. Each student completes the food variety questionnaire, and the healthy-weight group produces a mean of µ = 4.01 for the fatty,…arrow_forward
arrow_back_ios
arrow_forward_ios
Recommended textbooks for you
- MATLAB: An Introduction with ApplicationsStatisticsISBN:9781119256830Author:Amos GilatPublisher:John Wiley & Sons Inc
 Probability and Statistics for Engineering and th...StatisticsISBN:9781305251809Author:Jay L. DevorePublisher:Cengage Learning
 Statistics for The Behavioral Sciences (MindTap C...StatisticsISBN:9781305504912Author:Frederick J Gravetter, Larry B. WallnauPublisher:Cengage Learning
  Elementary Statistics: Picturing the World (7th E...StatisticsISBN:9780134683416Author:Ron Larson, Betsy FarberPublisher:PEARSON
 The Basic Practice of StatisticsStatisticsISBN:9781319042578Author:David S. Moore, William I. Notz, Michael A. FlignerPublisher:W. H. Freeman
 Introduction to the Practice of StatisticsStatisticsISBN:9781319013387Author:David S. Moore, George P. McCabe, Bruce A. CraigPublisher:W. H. Freeman
MATLAB: An Introduction with Applications
Statistics
ISBN:9781119256830
Author:Amos Gilat
Publisher:John Wiley & Sons Inc
Probability and Statistics for Engineering and th...
Statistics
ISBN:9781305251809
Author:Jay L. Devore
Publisher:Cengage Learning
Statistics for The Behavioral Sciences (MindTap C...
Statistics
ISBN:9781305504912
Author:Frederick J Gravetter, Larry B. Wallnau
Publisher:Cengage Learning
Elementary Statistics: Picturing the World (7th E...
Statistics
ISBN:9780134683416
Author:Ron Larson, Betsy Farber
Publisher:PEARSON
The Basic Practice of Statistics
Statistics
ISBN:9781319042578
Author:David S. Moore, William I. Notz, Michael A. Fligner
Publisher:W. H. Freeman
Introduction to the Practice of Statistics
Statistics
ISBN:9781319013387
Author:David S. Moore, George P. McCabe, Bruce A. Craig
Publisher:W. H. Freeman