Advanced Engineering Mathematics
10th Edition
ISBN: 9780470458365
Author: Erwin Kreyszig
Publisher: Wiley, John & Sons, Incorporated
expand_more
expand_more
format_list_bulleted
Question
please give the answer of "a"

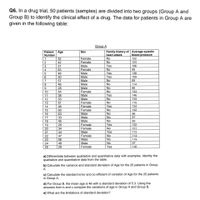
Transcribed Image Text:Q6. In a drug trial, 50 patients (samples) are divided into two groups (Group A and
Group B) to identify the clinical effect of a drug. The data for patients in Group A are
given in the following table:
Group A
Patient
Number
Family history of Average systolic
heart attack
Age
Sex
blood pressure
No
No
Yes
Female
122
1
2
32
42
Female
124
Male
Female
Male
Male
Male
156
31
63
3
4
No
99
Yes
Yes
No
No
138
48
30
109
57
89
8
46
Male
114
No
Male
Female
Male
Male
28
86
10
54
No
134
Yes
146
11
12
38
No
134
53
51
No
Female
Female
13
115
Yes
No
14
46
134
15
Female
132
60
63
16
Male
No
96
Male
Male
17
33
No
87
18
45
No
93
Yes
No
Yes
19
29
Female
152
121
Female
Male
34
20
21
44
112
22
47
Female
No
114
23
56
Male
No
119
No
Male
Female
24
48
97
25
29
Yes
120
a) Differentiate between qualitative and quantitative data with examples. Identity the
qualitative and quantitative data from the table.
b) Calculate the variance and standard deviation of Age for the 25 patients in Group
А.
c) Calculate the standard error and co-efficient of variation of Age for the 25 patients
in Group A.
d) For Group B, the mean age is 46 with a standard deviation of 5.3. Using the
answers from b and c compare the variations of age in Group A and Group B.
e) What are the limitations of standard deviation?
Expert Solution
This question has been solved!
Explore an expertly crafted, step-by-step solution for a thorough understanding of key concepts.
This is a popular solution
Trending nowThis is a popular solution!
Step by stepSolved in 2 steps

Knowledge Booster
Learn more about
Need a deep-dive on the concept behind this application? Look no further. Learn more about this topic, advanced-math and related others by exploring similar questions and additional content below.Similar questions
arrow_back_ios
arrow_forward_ios
Recommended textbooks for you
 Advanced Engineering MathematicsAdvanced MathISBN:9780470458365Author:Erwin KreyszigPublisher:Wiley, John & Sons, Incorporated
 Numerical Methods for EngineersAdvanced MathISBN:9780073397924Author:Steven C. Chapra Dr., Raymond P. CanalePublisher:McGraw-Hill Education
 Introductory Mathematics for Engineering Applicat...Advanced MathISBN:9781118141809Author:Nathan KlingbeilPublisher:WILEY
 Mathematics For Machine TechnologyAdvanced MathISBN:9781337798310Author:Peterson, John.Publisher:Cengage Learning,


Advanced Engineering Mathematics
Advanced Math
ISBN:9780470458365
Author:Erwin Kreyszig
Publisher:Wiley, John & Sons, Incorporated

Numerical Methods for Engineers
Advanced Math
ISBN:9780073397924
Author:Steven C. Chapra Dr., Raymond P. Canale
Publisher:McGraw-Hill Education

Introductory Mathematics for Engineering Applicat...
Advanced Math
ISBN:9781118141809
Author:Nathan Klingbeil
Publisher:WILEY

Mathematics For Machine Technology
Advanced Math
ISBN:9781337798310
Author:Peterson, John.
Publisher:Cengage Learning,

