Related questions
Question
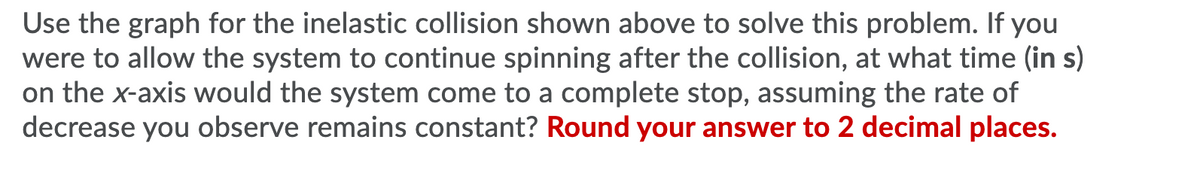

Transcribed Image Text:Use the graph for the inelastic collision shown above to solve this problem. If you
were to allow the system to continue spinning after the collision, at what time (in s)
on the x-axis would the system come to a complete stop, assuming the rate of
decrease you observe remains constant? Round your answer to 2 decimal places.

Transcribed Image Text:Q6 to Q10 are based on the following graph that shows the angular velocity as a
function of time for an inelastic collision between two discs, similar to the collision
done in Part 2 of your lab.
Inelastic collision
50-
40-
Linear Fit for: Data Set | Ang. velocity
omega = mt+b
m (Slope): -0.5269 rad/s/s
b (Y-Intercept): 47.10 rad/s
Correlation: -0.9983
RMSE: 0.06649 rad/s
Statistics for: Data Set |Ang. velocity
min: 20.81 at 10.69 max: 41.91 at 9.963
30-
Linear Fit for: Data Set | Ang. velocity
omega = mt+b
m (Slope): -0.2070 rad/s/s
b (Y-Intercept): 22.88 rad/s
Correlation: -0.9744
RMSE: 0.1089 rad/s
20-
10-
10
15
20
(5.72, 19.03) (At:22.00 Ay:0.00)
Time (s)
Ang. velocity (rad/s)
Expert Solution
This question has been solved!
Explore an expertly crafted, step-by-step solution for a thorough understanding of key concepts.

Step by stepSolved in 3 steps with 1 images

Knowledge Booster

Similar questions
- 4. A bullet fired into a block of wood to determine the speed of the bullet. The block is attached by a rod to a low friction axle. The bullet becomes embedded in the wood and the maximum angle the rod rotates is measured. a. Use the numbers in the diagram to determine the speed of the bullet before it hit the block of wood. Hint: use the angle to determine the speed of the block and bullet just after the bullet becomes embedded in the wood. ミミ 30° 0.8 m 0.8 kg 4 gram: b. How much mechanical energy was lost during the collision? Comment: You should find that most of the mechanical energy was lost.arrow_forwardA plane flies 36.0° north of east for 1.80 km to get to city B. The trip takes 3.00 hours. The plane departs city B and travels due west to reach city C. City C is 811 km from city B and the trip takes 1.80 hours. Let the positive 2-direction point due east and the positive y-direction point due north. a) Which vector below represents the plane's average velocity? N B E OĎarrow_forward4 Given a triangular area of right side a, total mass m, with one perpendicular side of the z axis. The surface is rotated about the z-axis by angular velocity w. Find the Lz component of the surface momentum.arrow_forward
- 3. 2. Collisions and Angular Momentum Example. Consider a ball of clay with a mass of 1.5 kg thrown at a thin vertical rod of mass 6 kg and length 1 m. with its axis at the top end. The clay strikes the bottom of the rod with a speed of 4 m/s and sticks to the bar, causing the bar to rotate, Assuming no other forces are acting on the system, do the following: a) Find angular speed of the rod and ball after the collision. b) State the angular momentum of each body in the system before and after the collision. Is angular momentum conserved? c) Find the kinetic energy of the system before and after the collision. Is mechanical energy conserved?arrow_forwardBelow four different load arrangements are show for a meter stick. For each case the masses are placed on the meter stick, which is held in equilibrium and then released and allowed to rotate. Rank the change in angular momentum for each stick one second after it is released. Rank the this change from greatest to least I. 050 kg LOkg I. 050kg LOkg III. S0 kg LOkg IV. 0.50 kg LOke O a. Il > | > II| > IV o b. IV > I> III > || c. I > III > I| > IV O d. III > I| > IV >arrow_forwardThe angular momentum of a freely rotating disk around its center is Ldisk. A heavy block is tossed horizontally onto the disk from two different orientations, but with the same speed, as shown in the figure. Friction acts between the disk and the block, so that the block is brought to rest on the disk and rotates with it. In which case is the magnitude of the final angular momentum of the disk-block system the greatest? a) same for both b) Case A c) Case Barrow_forward
- Mass=1/12Marrow_forwardA disk initially at rest is fixed to a vertical axis of rotation and a 40 kg child is standing on the disk initially at rest 0.5 meters away from the axis of rotation. The rotational inertia of the disk is 50 kgm2. The boy pushes and jumps off the disk and the disk begins to rotate at 0.5 rad/s. Calculate the linear velocity of the child as they push off the disk.arrow_forwardQuestion 6 6 of 7 I Review A student rotates on a frictionless piano stool with his arms outstretched, a heavy weight in each hand. Suddenly he lets go of the weights, and they fall to the floor. Part A As a result, does the student's angular speed increase, decrease, or stay the same? stay the same increase decrease Submit Request Answer Part B Choose the best explanation from among the following: The loss of angular momentum when the weights are dropped causes the student to rotate more slowly. The student's moment of inertia is decreased by dropping the weights. Dropping the weights exerts no torque on the student, but the floor exerts a torque on the weights when they land.arrow_forward
- 7. A 0.25 kg bullet is fired with a velocity of 200 m/s into two spheres mounted on a shaft with a vertical axis of rotation (coming out of the page) the spheres rotate horizontally. Each sphere has a mass of 0.80 kg and can be treated as a point mass. The mass of the shaft can be ignored. The bullet hits one of the spheres at the angle shown and sticks to the sphere which starts at rest. 30° Axis Of Rotation Determine the rotational inertia of the bullet/spheres system. C. d. Determine the magnitude of the angular velocity of the bullet/spheres system just after the bullet hits the sphere. 0.50 marrow_forwardege.com/course.html?courseld%=16202200&OpenVellumHMAC=a34faccb64fc064a9ce89812d0e27d84#10001 PH114 Fall 2020 Godang Course Home <9 Problem 11.54 A 0.019 kg record with a radius of 11 cm rotates with an angular speed of 33 3 rpm. Part A Find the angular momentum of the record. Express your answer using two significant figures. Hνα ΑΣφ L = kg · m² /s Submit Previous Answers Request Answer X Incorrect; Try Again; One attempt remaining Provide Feedback MacBook Air 80 DII DD F3 F4 F5 F6 F7 F8 F9 23 %24 & * 4. 7 8 < CO 5arrow_forwardTwo identical meter sticks are connected as shown in the diagram. The origin of the coordinate system is located where the two meter sticks are joined. y 1 m 1 m What is the moment of inertia of the two sticks about an axis perpendicular to meter sticks and passing through the center of mass of the whole system? Assume each meter stick has a mass m and length L.arrow_forward
arrow_back_ios
SEE MORE QUESTIONS
arrow_forward_ios