Big Ideas Math A Bridge To Success Algebra 1: Student Edition 2015
1st Edition
ISBN: 9781680331141
Author: HOUGHTON MIFFLIN HARCOURT
Publisher: Houghton Mifflin Harcourt
expand_more
expand_more
format_list_bulleted
Question

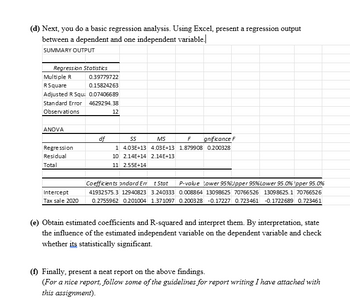
Transcribed Image Text:(d) Next, you do a basic regression analysis. Using Excel, present a regression output
between a dependent and one independent variable.
SUMMARY OUTPUT
Regression Statistics
Multiple R
RSquare
0.39779722
0.15824263
Adjusted R Squi 0.07406689
Standard Error
Observations
ANOVA
4629294.38
12
df
Regression
Residual
Total
55
MS
F
gnificance F
1 4.03E+13 4.03E+13 1.879908 0.200328
10 2.14E+14 2.14E+13
11 2.55E+14
Intercept
Tax sale 2020
Coefficients andard Err t Stat P-value Lower 95% Upper 95% Lower 95.0% Ipper 95.0%
41932575.3 12940823 3.240333 0.008864 13098625 70766526 13098625.1 70766526
0.2755962 0.201004 1.371097 0.2003 28 -0.17227 0.723461 -0.1722689 0.723461
(e) Obtain estimated coefficients and R-squared and interpret them. By interpretation, state
the influence of the estimated independent variable on the dependent variable and check
whether its statistically significant.
(f) Finally, present a neat report on the above findings.
(For a nice report, follow some of the guidelines for report writing I have attached with
this assignment).

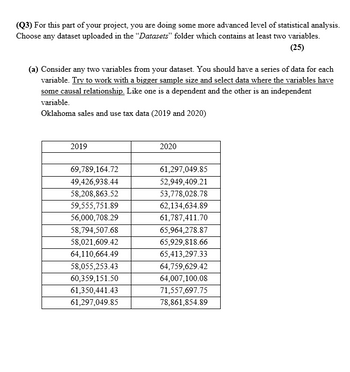
Transcribed Image Text:(Q3) For this part of your project, you are doing some more advanced level of statistical analysis.
Choose any dataset uploaded in the "Datasets" folder which contains at least two variables.
(25)
(a) Consider any two variables from your dataset. You should have a series of data for each
variable. Try to work with a bigger sample size and select data where the variables have
some causal relationship. Like one is a dependent and the other is an independent
variable.
Oklahoma sales and use tax data (2019 and 2020)
2019
2020
69,789,164.72
61,297,049.85
49,426,938.44
52,949,409.21
58,208,863.52
53,778,028.78
59,555,751.89
62,134,634.89
56,000,708.29
61,787,411.70
58,794,507.68
65,964,278.87
58,021,609.42
65,929,818.66
64,110,664.49
65,413,297.33
58,055,253.43
64,759,629.42
60,359,151.50
64,007,100.08
61,350,441.43
71,557,697.75
61,297,049.85
78,861,854.89
Expert Solution
This question has been solved!
Explore an expertly crafted, step-by-step solution for a thorough understanding of key concepts.
Step by stepSolved in 2 steps with 1 images

Knowledge Booster
Similar questions
Recommended textbooks for you
 Big Ideas Math A Bridge To Success Algebra 1: Stu...AlgebraISBN:9781680331141Author:HOUGHTON MIFFLIN HARCOURTPublisher:Houghton Mifflin Harcourt
 Glencoe Algebra 1, Student Edition, 9780079039897...AlgebraISBN:9780079039897Author:CarterPublisher:McGraw Hill
 Holt Mcdougal Larson Pre-algebra: Student Edition...AlgebraISBN:9780547587776Author:HOLT MCDOUGALPublisher:HOLT MCDOUGAL
 Functions and Change: A Modeling Approach to Coll...AlgebraISBN:9781337111348Author:Bruce Crauder, Benny Evans, Alan NoellPublisher:Cengage Learning

Big Ideas Math A Bridge To Success Algebra 1: Stu...
Algebra
ISBN:9781680331141
Author:HOUGHTON MIFFLIN HARCOURT
Publisher:Houghton Mifflin Harcourt

Glencoe Algebra 1, Student Edition, 9780079039897...
Algebra
ISBN:9780079039897
Author:Carter
Publisher:McGraw Hill

Holt Mcdougal Larson Pre-algebra: Student Edition...
Algebra
ISBN:9780547587776
Author:HOLT MCDOUGAL
Publisher:HOLT MCDOUGAL

Functions and Change: A Modeling Approach to Coll...
Algebra
ISBN:9781337111348
Author:Bruce Crauder, Benny Evans, Alan Noell
Publisher:Cengage Learning
