A First Course in Probability (10th Edition)
10th Edition
ISBN: 9780134753119
Author: Sheldon Ross
Publisher: PEARSON
expand_more
expand_more
format_list_bulleted
Question

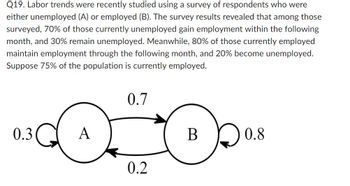
Transcribed Image Text:Using the probabilities and states given, what percentage of the population will likely
be employed two months from now? (Enter numerical value only. Do not enter %
sign. Round the percentage to 1 decimal place, or to the nearest tenth of a percent.)

Transcribed Image Text:Q19. Labor trends were recently studied using a survey of respondents who were
either unemployed (A) or employed (B). The survey results revealed that among those
surveyed, 70% of those currently unemployed gain employment within the following
month, and 30% remain unemployed. Meanwhile, 80% of those currently employed
maintain employment through the following month, and 20% become unemployed.
Suppose 75% of the population is currently employed.
0.7
0.3
A
0.2
B
0.8
Expert Solution
This question has been solved!
Explore an expertly crafted, step-by-step solution for a thorough understanding of key concepts.
This is a popular solution
Trending nowThis is a popular solution!
Step by stepSolved in 2 steps with 2 images

Knowledge Booster
Similar questions
- Example 40 A survey asks: Which online services have you used in the last month: Twitter ● Facebook Have used both The results show 40% of those surveyed have used Twitter, 70% have used Facebook, and 20% have used both. How many people have used neither Twitter or Facebook?arrow_forwardC8. According to the Pew Research Center (2015), recent immigrants are better educated than earlier immigrants to the United States. The change was attributed to the availability of better education in each region or country of origin. The percentage of immigrants 25 years of age and older who completed at least high school is reported in this table for 1970 to 2013. Write a statement describing the change over time in the percentage who completed at least a high school degree. 1970 1980 1990 2000 2013 Mexico 14 17 26 30 48 Other Central/South America 57 53 60 66 Asia 75 72 75 82 84 48 68 81 87 95 Europe 36 48 52 58 72 Caribbean 81 91 88 85 85 Africa Source: Pew Research Center, Modern Immigration Wave Brings 59 Million to U.S., Driving Population Growth and Change Through 2065, 2015. Retrieved from https://www.pewresearch.org/hispanic/2015/09/28/modern- immigration-wave-brings-59-million-to-u-s-driving-population-growth-and-change-through-2065/ 52arrow_forwardDetermine whether the study depicts an observational study or an experiment. A scientist was studying the effects of a new fertilizer on crop yield. She randomly assigned half of the plots on a farm to group one and the remaining plots to group two. On the plots in group one, the new fertilizer was used for a year. On the plots in group two, the old fertilizer was used. At the end of the year the average crop yield for the plots in group one was compared with the average crop yield for the plots in group two.arrow_forward
- Which of the following is a Research Question that can be answered using data? How do people arrive in the Emergency Department? Which hospital gown are patients most comfortable wearing? How many people are obese in a given community? All of the Abovearrow_forward6. Which of these relationships would be better described with a Spearman's rank coefficient than with a Pearson's coefficient? a. The association between income and educational attainment (measured in years of school) b. The association between hours of sleep and score on an exam C. The association between years aged and price of wine d. The association between ice cream sales and crime rates e. The association between number on NY Times Best Seller List and copies of book soldarrow_forwardA2. A study of test results at different schools shows that as the student-to-teacher ratio increases the average test result tends to decrease, although the relationship is quite weak. Which of the following is plausible value for the correlation between student-to- teacher ratio and average test results? A -0.9 B -0.3 C -0.01 D 0.3 E 0.9arrow_forward
- 4. Straight As now, healthy later A study by Pamela Herd of the University of Wisconsin-Madison found a link between high-school grades and health. Analyzing data from the Wisconsin Longitudinal Study, which has tracked the lives of thousands of Wisconsin high-school graduates from the class of 1957, Herd found that students with higher grade-point averages were more likely to say they were in excellent or very good health in their early 60s. Does this mean people will live healthier lives if they increase their GPA? Explain.47arrow_forward1.18 Cats on YouTube. Suppose you want to estimate the percentage of videos on YouTube that are cat videos. It is impossible for you to watch all videos on YouTube so you use a random video picker to select 1000 videos for you. You find that 2% of these videos are cat videos. Determine which of the following is an observation, a variable, a sample statistic (value calculated based on the observed sample), or a population parameterarrow_forwardSuppose we have the following data available for the average number of hours spent in the Santa Fe College Math lab. Male Female 1.50 0.75 1.20 0.82 1.30 0.91 1.05 0.84 0.75 0.59 0.80 1.02 1.00 1.90 0.95 2.10 0.925 2.20 2.50 2.50 3.00 3.50 3.50 2.20 4.01 1.80 Use Data Displays to comment on the shape of the distribution, measures of center and spread, possible skew, and outliers for both genders. (Hint: Use as many displays as needed.)arrow_forward
arrow_back_ios
arrow_forward_ios
Recommended textbooks for you
 A First Course in Probability (10th Edition)ProbabilityISBN:9780134753119Author:Sheldon RossPublisher:PEARSON

A First Course in Probability (10th Edition)
Probability
ISBN:9780134753119
Author:Sheldon Ross
Publisher:PEARSON
