
MATLAB: An Introduction with Applications
6th Edition
ISBN: 9781119256830
Author: Amos Gilat
Publisher: John Wiley & Sons Inc
expand_more
expand_more
format_list_bulleted
Related questions
Question
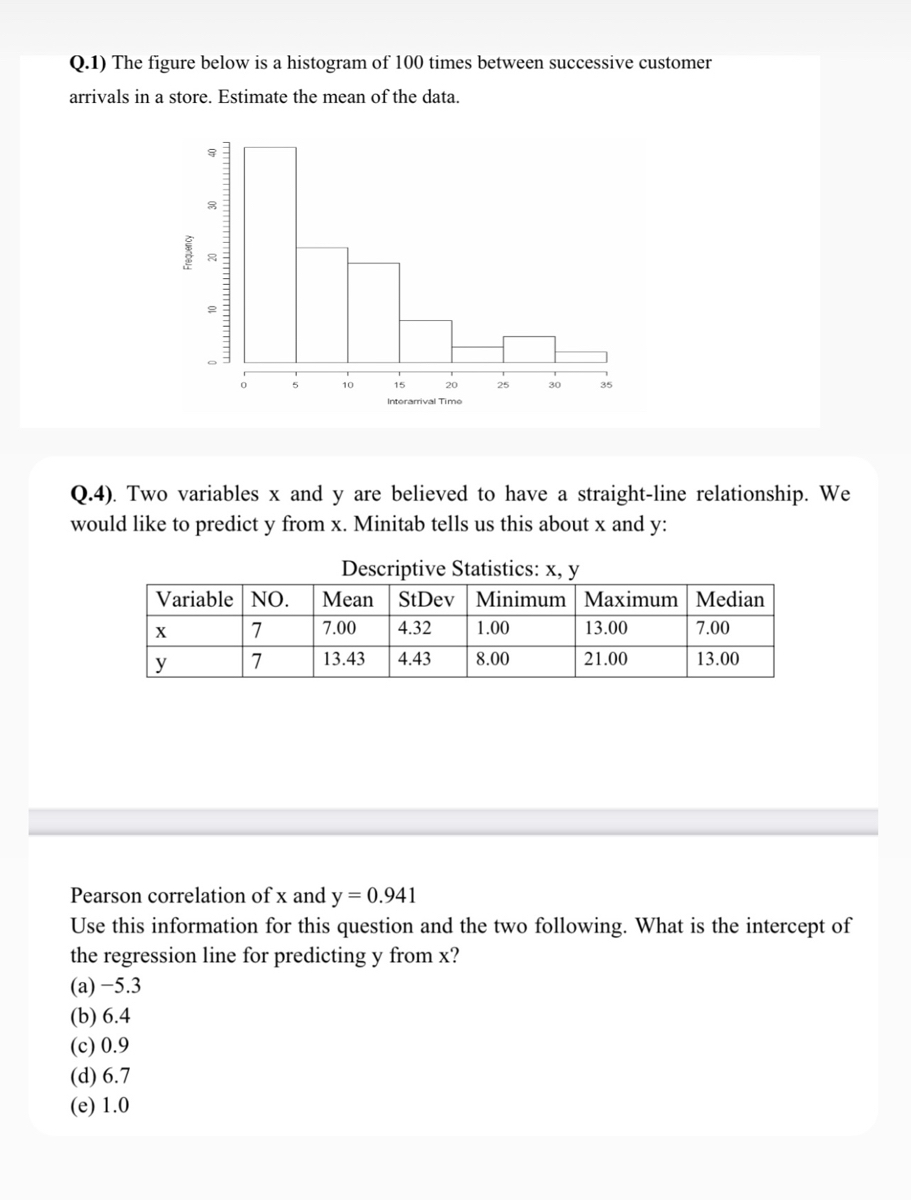

Transcribed Image Text:Q.1) The figure below is a histogram of 100 times between successive customer
arrivals in a store. Estimate the mean of the data.
10
20
25
35
Intorarival Timo
Q.4). Two variables x and y are believed to have a straight-line relationship. We
would like to predict y from x. Minitab tells us this about x and y:
Descriptive Statistics: x, y
StDev Minimum Maximum Median
Variable | NO.
Mean
X
7
7.00
4.32
1.00
13.00
7.00
y
7
13.43
4.43
8.00
21.00
13.00
Pearson correlation of x and y= 0.941
Use this information for this question and the two following. What is the intercept of
the regression line for predicting y from x?
(а) —5.3
(b) 6.4
(c) 0.9
(d) 6.7
(e) 1.0
Expert Solution
This question has been solved!
Explore an expertly crafted, step-by-step solution for a thorough understanding of key concepts.

Step by stepSolved in 3 steps

Knowledge Booster

Similar questions
- 2. The speeds (in km/hr) of 14 roller coasters found around the world are given below. Find the median. upper and lower quartiles, the maximum and minimum, then make a box plot to display the data. 149, 85, 85, 120, 128, 107, 85, 104, 105.6, 104, 95, 93, 92, 90 Min: Q1: Median: Q3: Max:arrow_forward3. Learn by doing (page 68): In this data, X = annual cigarette consumption per capita in the U.S. and Y = lung cancers per 100,000. To investigate the connection between cigarette consumption and lung cancers, the data is offset by 30 years since cancer takes time to develop. For example, cigarette consumption in ciaarettes and cancer Scatter Plot: graph of lung cancer rates and cigarette consumption 70 60 50 40 30 20- 3200 3400 3600 3800 4000 4200 4400 4600 (per_capita) (000001 1ad) Aarrow_forwardFollowing this week's empirical application, the scatter plot below plots average rain in a city (vertical axis) against average PM 10 levels in a city (horizontal axis). Based on this figure, what appears to be true? Average Rain in a City u Rain vs Pollution by City 120 Average PM10 in a City 160 Cities with more rain tend to have less pollution O Cities with less pollution tend to have less rain O There is no statistical relationship between rain and pollution O Cities with more rain tend to have more pollutionarrow_forward
- Create a scatter plot for the following. 15 17 40 40 X Y 19 38 20 35 Run the test for Linear Correlation. What is the (t) test statistic? (Round to 2 decimal places) 20 31 21 32 22 28 22 25 23 25arrow_forwardWhich of the following measures the direction of the linear relationship between two variables but does not measure the strength of the relationship? coefficient of variation correlation coefficient covariance variancearrow_forward00 T R # 3 6 Question 22 Approximate the median for following GFDT. (Report answer as the midpoint of the class median.) Data Frequency 40-44 1. 45 - 49 1. 50 - 54 3. 55 - 59 8. 12 60 64 69 69 10 22 70 - 74 75-79 80 84 12 median = %3D Submit Question MacBook Air 08 F3 F1 DD F2 F4 F5 i $ 2 4. 9- Aarrow_forward
- A correlation coefficient provides two pieces of information about a relationship between two variables. These are -Strength; direction of relationship - Direction, proportions - Direction, which one causes which - Which one causes which, effect size. READ FIRST: Show as much of your work in the text box below as possible, and include the rest in your scratch work. Scratch work supports what you write on this exam form. At the minimum, type your answers to each of the following 5 questions A-E in the text box - do not refer me to your scratch work for the answers. Do show your work (on the exam form or scratch work) for the calculations needed to answer B, so partial credit can be given in the case of a math error that throws off your calculations. The best way to do this is inside tables if possible. Total 10 15 You conduct a survey to find out whether talking on a cell phone during a romantic date bothers people. You want to find out if there is a gender difference on this issue,…arrow_forwardTwo variables have a strong negative correlation. Which of the following statements is most accurate?a. the data points lie very close to the line of best fitb. the line of best fit must have a large negative slopec. the line of best fit must have a large positive sloped. many data points do not lie very close to the line of best fite. none of the statements are accurate I Know its between a or b but want to double check as I belive its A but see some others saying its B thanksarrow_forwardX Y 14 25 26 28 19 27 13 21 28 31 23 24 30 31 26 27 19 29 Mean. 22 27 Std. Dev 6.08 3.28 Correlation 0.76 What is the tcritical value using the direct difference approach?arrow_forward
arrow_back_ios
SEE MORE QUESTIONS
arrow_forward_ios
Recommended textbooks for you
- MATLAB: An Introduction with ApplicationsStatisticsISBN:9781119256830Author:Amos GilatPublisher:John Wiley & Sons Inc
 Probability and Statistics for Engineering and th...StatisticsISBN:9781305251809Author:Jay L. DevorePublisher:Cengage Learning
 Statistics for The Behavioral Sciences (MindTap C...StatisticsISBN:9781305504912Author:Frederick J Gravetter, Larry B. WallnauPublisher:Cengage Learning
  Elementary Statistics: Picturing the World (7th E...StatisticsISBN:9780134683416Author:Ron Larson, Betsy FarberPublisher:PEARSON
 The Basic Practice of StatisticsStatisticsISBN:9781319042578Author:David S. Moore, William I. Notz, Michael A. FlignerPublisher:W. H. Freeman
 Introduction to the Practice of StatisticsStatisticsISBN:9781319013387Author:David S. Moore, George P. McCabe, Bruce A. CraigPublisher:W. H. Freeman
MATLAB: An Introduction with Applications
Statistics
ISBN:9781119256830
Author:Amos Gilat
Publisher:John Wiley & Sons Inc
Probability and Statistics for Engineering and th...
Statistics
ISBN:9781305251809
Author:Jay L. Devore
Publisher:Cengage Learning
Statistics for The Behavioral Sciences (MindTap C...
Statistics
ISBN:9781305504912
Author:Frederick J Gravetter, Larry B. Wallnau
Publisher:Cengage Learning
Elementary Statistics: Picturing the World (7th E...
Statistics
ISBN:9780134683416
Author:Ron Larson, Betsy Farber
Publisher:PEARSON
The Basic Practice of Statistics
Statistics
ISBN:9781319042578
Author:David S. Moore, William I. Notz, Michael A. Fligner
Publisher:W. H. Freeman
Introduction to the Practice of Statistics
Statistics
ISBN:9781319013387
Author:David S. Moore, George P. McCabe, Bruce A. Craig
Publisher:W. H. Freeman