
MATLAB: An Introduction with Applications
6th Edition
ISBN: 9781119256830
Author: Amos Gilat
Publisher: John Wiley & Sons Inc
expand_more
expand_more
format_list_bulleted
Related questions
Concept explainers
Question
Temperature in degrees Fahrenheit and number of emergency calls are shown in this table:
The fitted regression line intercept is -7.544 and regression coefficient 0.190, find the
error terms.
Q. 20: When the value of temperature in Q19 is 85 and 105 then find the No. of calls y and comment on these values
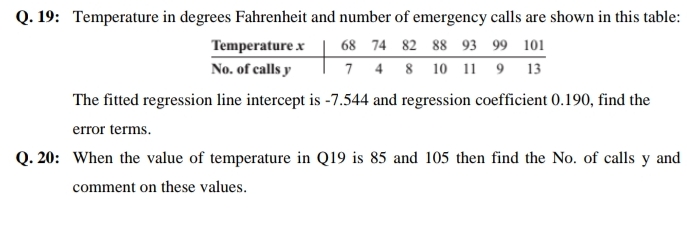

Transcribed Image Text:Q. 19: Temperature in degrees Fahrenheit and number of emergency calls are shown in this table:
Temperature x
68 74 82 88 93 99 101
No. of calls y
7 4 8 10 11 9 13
The fitted regression line intercept is -7.544 and regression coefficient 0.190, find the
error terms.
Q. 20: When the value of temperature in Q19 is 85 and 105 then find the No. of calls y and
comment on these values.
Expert Solution
This question has been solved!
Explore an expertly crafted, step-by-step solution for a thorough understanding of key concepts.

This is a popular solution

Trending nowThis is a popular solution!

Step by stepSolved in 3 steps

Knowledge Booster


Learn more about
Need a deep-dive on the concept behind this application? Look no further. Learn more about this topic, statistics and related others by exploring similar questions and additional content below.Similar questions
- Find the regression line (even if there isn't correlation in the population) Write the meaning of the slope of the regression line: Find the best predicted score a wife would have, if her husband scored 50:arrow_forwardI’m taking a statistics and probability class. Please get this correct because I want to learn. I have gotten wrong answers on here beforearrow_forwardA researcher that there is a linear association between the level of potassium content (y) in milligrams and the amount of fiber (x) in grams in cereal. The regression line for the data is computed to y=37+28x rate. It was also computed that r=.59 A. What does the value . 59 tell you? B. What does the value 37 tell you? C. What does the value 28 tell you ? 2. For the line in question 1 what percentage of variability in potassium can be explained by variability in fiber?arrow_forward
- Please solve what’s not filled in.arrow_forwardFind the equation of the regression line for the given data. Then construct a scatter plot of the data and draw the regression line. (Each pair of variables has a significant correlation.) Then use the regression equation to predict the value of y for each of the given x-values, if meaningful. The caloric content and the sodium content (in milligrams) for 6 beef hot dogs are shown in the table below. 170 480 Calories, x Sodium, y 560 Find the regression equation. ŷ=x+ (Round to three decimal places as needed.) Choose the correct graph below. OA. 0ff 0 200 150 430 Calories 130 320 a 130 380 O B. 560 0 80 250 200 G Calories (a) Predict the value of y for x = 160. Choose the correct answer below. OA. 390.863 OB. 440.983 OC. 591.343 O D. not meaningful (b) Predict the value of y for x = 90. Choose the correct answer below. 190 510 (a) x (c) x 160 calories 140 calories O C. A 560+ 0-T 0 200 Calories (b) x = 90 calories (d) x = 220 calories OD. 560- 0 200 Calories Qarrow_forwardUse the given data set to answer parts (a) and (b). a. Find the regression equation for the data points. X 5 b. Graph the regression equation and the data points. y -1 10 -10 y B. 10 -10- C. a. Find the regression equation for the data points. ŷ-0 (Use integers or decimals for any numbers in the expression. Round to two decimal places as needed.) b. Graph the regression equation and the data points. O A. 10 T -10- 1 2 -1 3 327 D. -10 4 y 4 28 0arrow_forward
- Using the weights (Ib) and highway fuel consumption amounts (mi/gal) of the 48 cars listed in the accompanying data set, one gets this regression equation: y = 58 9-0.00749x, where x represents weight Complete parts (a) through (d). Click the icon to view the car data. 東 b. What are the specific values of the slope and y-intercept of the regression line? O A. The slope is 58.9 and the y-intercept is 0.007499. B. The slope is -0.00749 and the y-intercept is 58.9. O C. The slope is 58.9 and the y-intercept is -0.00749. O D. The slope is 0.00749 and the y-intercept is 58.9. c. What is the predictor variable? O A. The predictor variable is highway fuel consumption, which is represented by x. B. The predictor variable is weight, which is represented by x. O C. The predictor variable is weight, which is represented by y O D. The predictor variable is highway fuel consumption, which is represented by y. d. Assuming that there is a significant linear correlation between weight and highway fuel…arrow_forwardn order for applicants to work for the foreign-service department, they must take a test in the language of the country where they plan to work. The data below shows the relationship between the number of years that applicants have studied a particular language and the grades they received on the proficiency exam. Find the equation of the regression line for the data. given Number of years, x 4 5 3 6 2 7 3 Grades on test, y 61 68 75 82 73 90 58 93 72 O A. y 6.910x+46.261 O B. -46.261x +6.910 O C. =6.910x-46.261 O D. = 46.261x-6.910 Next Time Remaining: 01:02:25 74°F Mostly 五 TTLarrow_forward
arrow_back_ios
arrow_forward_ios
Recommended textbooks for you
- MATLAB: An Introduction with ApplicationsStatisticsISBN:9781119256830Author:Amos GilatPublisher:John Wiley & Sons Inc
 Probability and Statistics for Engineering and th...StatisticsISBN:9781305251809Author:Jay L. DevorePublisher:Cengage Learning
 Statistics for The Behavioral Sciences (MindTap C...StatisticsISBN:9781305504912Author:Frederick J Gravetter, Larry B. WallnauPublisher:Cengage Learning
  Elementary Statistics: Picturing the World (7th E...StatisticsISBN:9780134683416Author:Ron Larson, Betsy FarberPublisher:PEARSON
 The Basic Practice of StatisticsStatisticsISBN:9781319042578Author:David S. Moore, William I. Notz, Michael A. FlignerPublisher:W. H. Freeman
 Introduction to the Practice of StatisticsStatisticsISBN:9781319013387Author:David S. Moore, George P. McCabe, Bruce A. CraigPublisher:W. H. Freeman
MATLAB: An Introduction with Applications
Statistics
ISBN:9781119256830
Author:Amos Gilat
Publisher:John Wiley & Sons Inc
Probability and Statistics for Engineering and th...
Statistics
ISBN:9781305251809
Author:Jay L. Devore
Publisher:Cengage Learning
Statistics for The Behavioral Sciences (MindTap C...
Statistics
ISBN:9781305504912
Author:Frederick J Gravetter, Larry B. Wallnau
Publisher:Cengage Learning
Elementary Statistics: Picturing the World (7th E...
Statistics
ISBN:9780134683416
Author:Ron Larson, Betsy Farber
Publisher:PEARSON
The Basic Practice of Statistics
Statistics
ISBN:9781319042578
Author:David S. Moore, William I. Notz, Michael A. Fligner
Publisher:W. H. Freeman
Introduction to the Practice of Statistics
Statistics
ISBN:9781319013387
Author:David S. Moore, George P. McCabe, Bruce A. Craig
Publisher:W. H. Freeman