Advanced Engineering Mathematics
10th Edition
ISBN: 9780470458365
Author: Erwin Kreyszig
Publisher: Wiley, John & Sons, Incorporated
expand_more
expand_more
format_list_bulleted
Question
Please do the following questions with handwritten working out

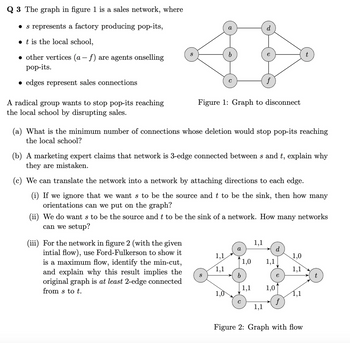
Transcribed Image Text:Q 3 The graph in figure 1 is a sales network, where
• s represents a factory producing pop-its,
⚫t is the local school,
-
• other vertices (a – f) are agents onselling
pop-its.
edges represent sales connections
S
t
A radical group wants to stop pop-its reaching
the local school by disrupting sales.
f
Figure 1: Graph to disconnect
(a) What is the minimum number of connections whose deletion would stop pop-its reaching
the local school?
(b) A marketing expert claims that network is 3-edge connected between s and t, explain why
they are mistaken.
(c) We can translate the network into a network by attaching directions to each edge.
(i) If we ignore that we want s to be the source and t to be the sink, then how many
orientations can we put on the graph?
(ii) We do wants to be the source and t to be the sink of a network. How many networks
can we setup?
(iii) For the network in figure 2 (with the given
intial flow), use Ford-Fulkerson to show it
is a maximum flow, identify the min-cut,
and explain why this result implies the
original graph is at least 2-edge connected
from s to t.
1,1
a
d
1,1
1,0
1,0 1,1
1,1
1,1
S
b
t
1,1 1,0
1,0
с
f
1,1
Figure 2: Graph with flow
Expert Solution
This question has been solved!
Explore an expertly crafted, step-by-step solution for a thorough understanding of key concepts.
Step by stepSolved in 2 steps

Knowledge Booster
Similar questions
Recommended textbooks for you
 Advanced Engineering MathematicsAdvanced MathISBN:9780470458365Author:Erwin KreyszigPublisher:Wiley, John & Sons, Incorporated
 Numerical Methods for EngineersAdvanced MathISBN:9780073397924Author:Steven C. Chapra Dr., Raymond P. CanalePublisher:McGraw-Hill Education
 Introductory Mathematics for Engineering Applicat...Advanced MathISBN:9781118141809Author:Nathan KlingbeilPublisher:WILEY
 Mathematics For Machine TechnologyAdvanced MathISBN:9781337798310Author:Peterson, John.Publisher:Cengage Learning,


Advanced Engineering Mathematics
Advanced Math
ISBN:9780470458365
Author:Erwin Kreyszig
Publisher:Wiley, John & Sons, Incorporated

Numerical Methods for Engineers
Advanced Math
ISBN:9780073397924
Author:Steven C. Chapra Dr., Raymond P. Canale
Publisher:McGraw-Hill Education

Introductory Mathematics for Engineering Applicat...
Advanced Math
ISBN:9781118141809
Author:Nathan Klingbeil
Publisher:WILEY

Mathematics For Machine Technology
Advanced Math
ISBN:9781337798310
Author:Peterson, John.
Publisher:Cengage Learning,

