Related questions
Question
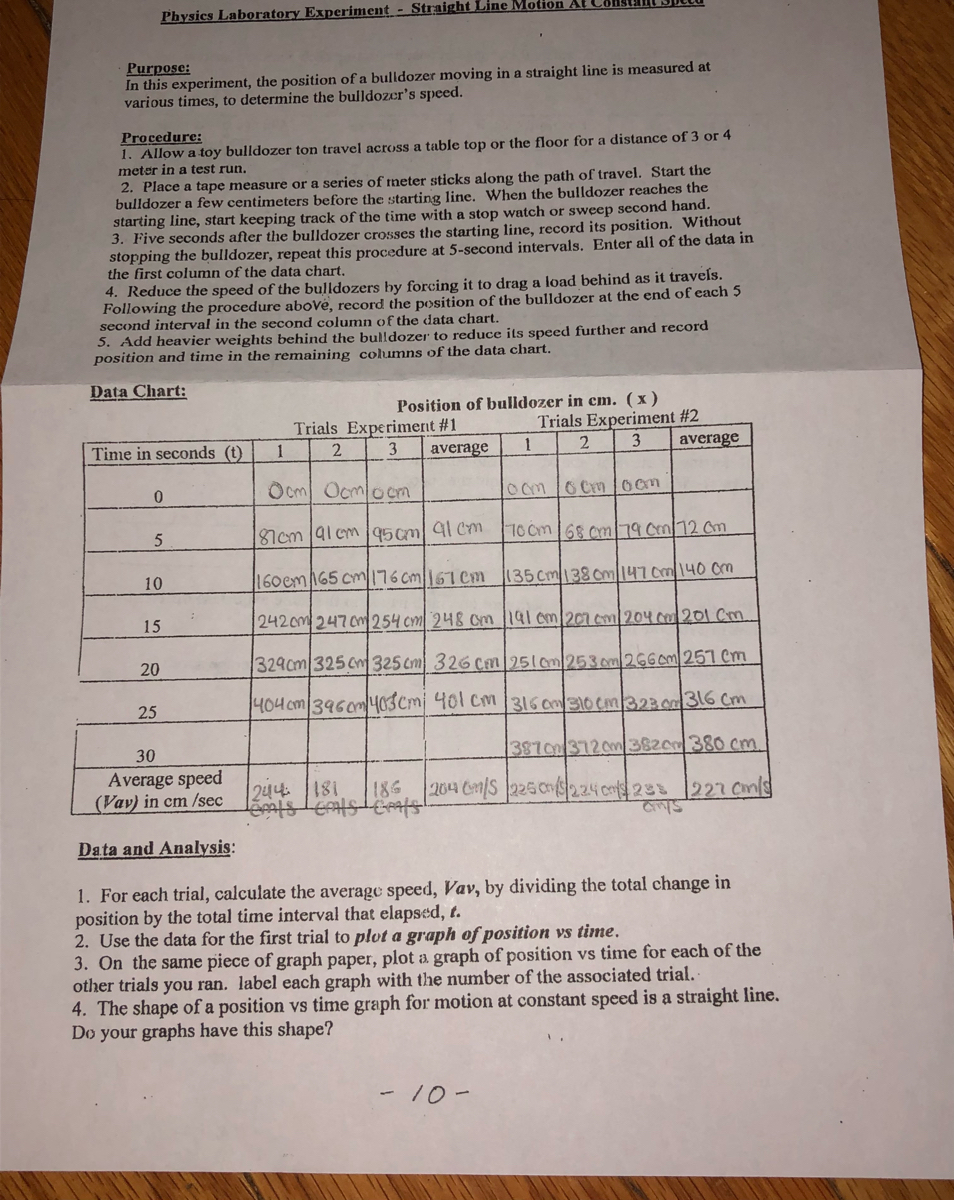
hellooo!! please help me plot the graph for these two trials and then find the slope

Transcribed Image Text:Physics Laboratory Experiment - Straight Line Motion At
Purpose:
In this experiment, the position of a bulldozer moving in a straight line is measured at
various times, to determine the bulldozer's speed.
Procedure:
1. Allow a toy bulldozer ton travel across
table top or the floor for a distance of 3 or 4
meter in a test run.
2. Place a tape measure or a series of meter sticks along the path of travel. Start the
bulldozer a few centimeters before the starting line. When the bulldozer reaches the
starting line, start keeping track of the time with a stop watch or sweep second hand.
3. Five seconds after the bulldozer crosses the starting line, record its position. Without
stopping the bulldozer, repeat this procedure at 5-second intervals. Enter all of the data in
the first column of the data chart,
4. Reduce the speed of the bulldozers by forcing it to drag a load behind as it traveſs.
Following the procedure above, record the position of the bulldozer at the end of each 5
second interval in the second column of the data chart.
5. Add heavier weights behind the bulldozer to reduce its speed further and record
position and time in the remaining columns of the data chart.
Data Chart:
Position of bulldozer in cm. (x)
Trials Experiment #2
average
Trials Experiment #1
Time in seconds (t)
3
average
3
Ocm Ocmlo cm
87cm 91 cm 95cm 91 Cm
10 Cm 68 cm/190m/72 Cm
10
160em165 cm176 Cm|61 Cm
135cm138cm147cm140 m
15
2420m 247c 254 cm 248 cm 191 em/20I om/204co201 Cm.
20
329cm 325 Cm325 cm 326 Cm 251om/253om2660m 251 Cm
25
404cm/3960m403cm¡ 40l cm 316 c0/310 Cm/323 o316 Cm
30
38700 3720m 3820380 cm.
Average speed
(Vav) in cm /sec
18 204 CanS 25 0n/224 c 283 227 Conls
244
181
Data and Analysis:
1. For each trial, calculate the average speed, Vav, by dividing the total change in
position by the total time interval that elapsed, t.
2. Use the data for the first trial to plut a graph of position vs time.
3. On the same piece of graph paper, plot a graph of position vs time for each of the
other trials you ran. label each graph with the number of the associated trial.-
4. The shape of a position vs time graph for motion at constant speed is a straight line.
Do your graphs have this shape?
- 10-
Expert Solution
This question has been solved!
Explore an expertly crafted, step-by-step solution for a thorough understanding of key concepts.

This is a popular solution

Trending nowThis is a popular solution!

Step by stepSolved in 2 steps with 1 images

Knowledge Booster

Similar questions
- In step 3, what happened to the first t in the equation when you start solving it?arrow_forwardPlease give the answers of c d step by steparrow_forwardFor questions 12-13 it ask to rewrite the equation to solve for the given variable, and for questions 15-18 it asks to determine the relationship between the variables indicated.arrow_forward
- Suppose your speedometer has an uncertainty of 4.5 km/h at a speed of 92 km/h. If the speedometer has the same percent uncertainty when it reads 55 km/h, what is the highest speed, in kilometers per hour, that you might be going? If the speedometer has the same percent uncertainty when it reads 55 km/h, what is the lowest speed, in kilometers per hour, that you might be going?arrow_forwardConsider the following equations, where x is a position, v is a velocity, a is an acceleration, and t is a time. Using dimension analysis, find what quantity is described by the equation? Options: Position, Velocity, Acceleration, None of the above 1/2 at^2 at x/t x/(t^2)arrow_forwardCan you please answer number 2 and all of the sub problems and show all of the steps to the solutionarrow_forward
arrow_back_ios
arrow_forward_ios