
MATLAB: An Introduction with Applications
6th Edition
ISBN: 9781119256830
Author: Amos Gilat
Publisher: John Wiley & Sons Inc
expand_more
expand_more
format_list_bulleted
Related questions
Question
thumb_up100%
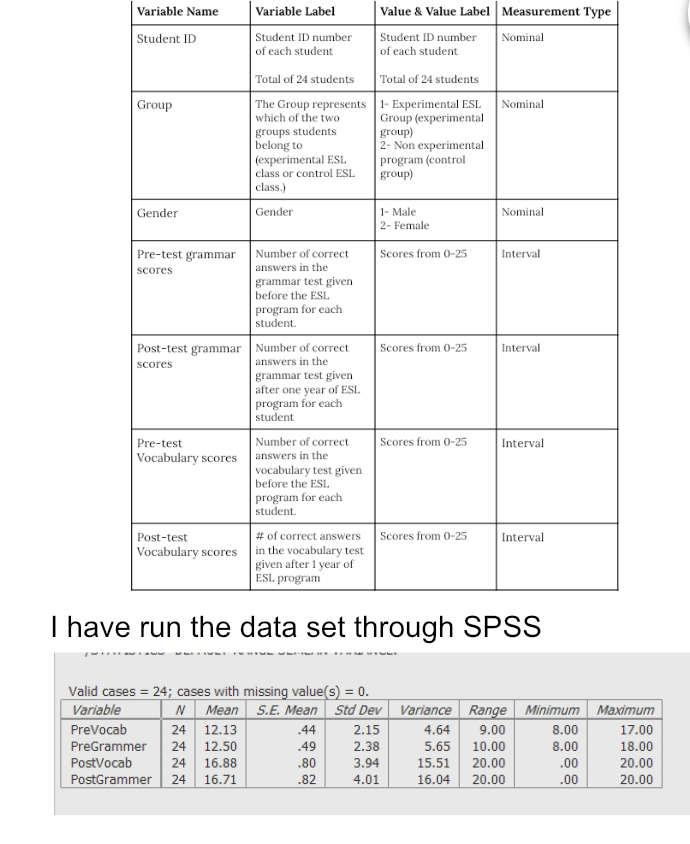

Transcribed Image Text:Variable Name
Student ID
Variable Label
Value & Value Label Measurement Type
Student ID number
of each student
Nominal
Student ID number
of each student
Total of 24 students
The Group represents 1- Experimental ESL Nominal
Total of 24 students
Group
which of the two
groups students
belong to
(experimental ESL.
class or control ESL
Group (experimental
group)
2- Non experimental
program (control
group)
class.)
Gender
Gender
1- Male
Nominal
2- Female
Pre-test grammar
Number of correct
Scores from 0-25
Interval
scores
answers in the
grammar test given
before the ESL
program for each
student.
Post-test grammar Number of correct
answers in the
Scores from 0-25
Interval
scores
grammar test given
after one year of ESL
program for each
student
Pre-test
Number of correct
Scores from 0-25
Interval
Vocabulary scores
answers in the
vocabulary test given
before the ESL.
program for each
student.
Post-test
# of correct answers Scores from 0-25
Interval
Vocabulary scores in the vocabulary test
given after 1 year of
ESL. program
I have run the data set through SPSS
Valid cases = 24; cases with missing value(s) = 0.
Variable
N Mean S.E. Mean Std Dev Variance Range Minimum Maximum
PreVocab
24 12.13
.44
2.15
4.64
9.00
8.00
17.00
PreGrammer
24
12.50
.49
2.38
5.65
10.00
20.00
8.00
18.00
PostVocab
24
16.88
.80
3.94
15.51
.00
20.00
PostGrammer
24
16.71
.82
4.01
16.04
20.00
.00
20.00

Transcribed Image Text:Question (use as many points as needed from
my account)
Produce appropriate descriptive statistics and
graphics – examples of these are measures of
central tendency and variability, frequency tables,
histograms, and bar charts. Descriptive statistics
should be provided for each individual study
variable except student ID
Expert Solution
This question has been solved!
Explore an expertly crafted, step-by-step solution for a thorough understanding of key concepts.

Step by stepSolved in 5 steps with 9 images

Knowledge Booster

Similar questions
- Given the following frequency table of values, is the mean or the median likely to be a better measure of the center of the data set? Value Frequency 21 2 42 3 43 8 46 7 49 3 51 1arrow_forwardPut these steps for the process of statistics in the correct order.arrow_forwardThe following frequency table summarizes a set of data. What is the five-number summary? Value Frequency 2 3 3 2 5 1 6 3 7 1 8 2 11 3arrow_forward
- Is the following nominal, ordinal, or interval data? Explain your answer. Stock pricesarrow_forwardThe following table summarizes the grade point averages (GPAs) of graduatestudents in a statistics class. Approximate the mean GPA of the class.arrow_forwardA statistic is a measure that describes a population characteristic.arrow_forward
arrow_back_ios
arrow_forward_ios
Recommended textbooks for you
- MATLAB: An Introduction with ApplicationsStatisticsISBN:9781119256830Author:Amos GilatPublisher:John Wiley & Sons Inc
 Probability and Statistics for Engineering and th...StatisticsISBN:9781305251809Author:Jay L. DevorePublisher:Cengage Learning
 Statistics for The Behavioral Sciences (MindTap C...StatisticsISBN:9781305504912Author:Frederick J Gravetter, Larry B. WallnauPublisher:Cengage Learning
  Elementary Statistics: Picturing the World (7th E...StatisticsISBN:9780134683416Author:Ron Larson, Betsy FarberPublisher:PEARSON
 The Basic Practice of StatisticsStatisticsISBN:9781319042578Author:David S. Moore, William I. Notz, Michael A. FlignerPublisher:W. H. Freeman
 Introduction to the Practice of StatisticsStatisticsISBN:9781319013387Author:David S. Moore, George P. McCabe, Bruce A. CraigPublisher:W. H. Freeman
MATLAB: An Introduction with Applications
Statistics
ISBN:9781119256830
Author:Amos Gilat
Publisher:John Wiley & Sons Inc
Probability and Statistics for Engineering and th...
Statistics
ISBN:9781305251809
Author:Jay L. Devore
Publisher:Cengage Learning
Statistics for The Behavioral Sciences (MindTap C...
Statistics
ISBN:9781305504912
Author:Frederick J Gravetter, Larry B. Wallnau
Publisher:Cengage Learning
Elementary Statistics: Picturing the World (7th E...
Statistics
ISBN:9780134683416
Author:Ron Larson, Betsy Farber
Publisher:PEARSON
The Basic Practice of Statistics
Statistics
ISBN:9781319042578
Author:David S. Moore, William I. Notz, Michael A. Fligner
Publisher:W. H. Freeman
Introduction to the Practice of Statistics
Statistics
ISBN:9781319013387
Author:David S. Moore, George P. McCabe, Bruce A. Craig
Publisher:W. H. Freeman