
MATLAB: An Introduction with Applications
6th Edition
ISBN: 9781119256830
Author: Amos Gilat
Publisher: John Wiley & Sons Inc
expand_more
expand_more
format_list_bulleted
Related questions
Question
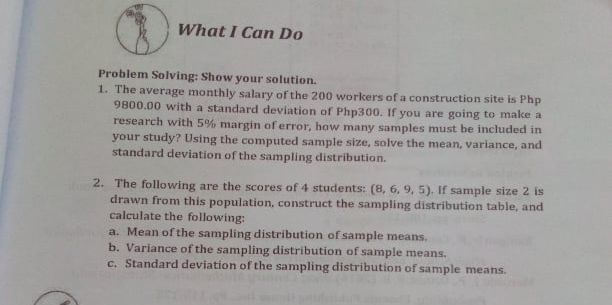

Transcribed Image Text:What I Can Do
Problem Solving: Show your solution.
1. The average monthly salary of the 200 workers of a construction site is Php
9800.00 with a standard deviation of Php300. If you are going to make a
research with 5% margin of error, how many samples must be included in
your study? Using the computed sample size, solve the mean, variance, and
standard deviation of the sampling distribution.
2. The following are the scores of 4 students: (8, 6, 9, 5). If sample size 2 is
drawn from this population, construct the sampling distribution table, and
calculate the following:
a. Mean of the sampling distribution of sample means.
b. Variance of the sampling distribution of sample means.
C. Standard deviation of the sampling distribution of sample means.
Expert Solution
This question has been solved!
Explore an expertly crafted, step-by-step solution for a thorough understanding of key concepts.

Step by stepSolved in 3 steps with 3 images

Knowledge Booster

Similar questions
- helparrow_forwarda. Develop a hypothesis test that can be used to determine whether the mean annual consumption in Webster City is higher than the national mean. Ho: $21.5 Ha: >21.5 b. What is a point estimate of the difference between mean annual consumption in Webster City and the national mean? (2 decimals) c. At a = 0.01, test for a significant difference by completing the following. Calculate the value of the test statistic (2 decimals). The p-value is Reject the null hypothesis? (4 decimals) Yes v What is your conclusion? Conclude the population mean consumption of milk in Webster City is greater thaarrow_forwardPlease answer the question in the photo. TY!arrow_forward
- Compare the population variance to the mean of the sample variances. Choose the correct answer below. A. The population variance is equal to the square root of the mean of the sample variances. B. The population variance is equal to the mean of the sample variances. C. The population variance is equal to the square of the mean of the sample variances.arrow_forwardHelp, please.arrow_forwardIf the mean height of bonsai trees is 52 cm with a standard deviation of 10 cm, what percent of the trees are above 82 cm? Select one: a. 0.3% O b. 82 O c. 3% O d. 0.15% Students at Roseville High School took an IQ test with a mean of 100 and a standard deviation of 15. Approximately, what percent of the students scored above 100? Answer: o represents thearrow_forward
- Find the estimated standard error for the sample mean for n = 13 and SS = 3639. Nearest hundredths place.arrow_forward1. Measure your height and find how many standard deviations you are from 50th percentile using the Anthropometry table in slide 17 in the Anthropometry slides. My height is 5 feet 7 inches. 2. Using this measured stature, estimate the lengths of your forearm, foot, and hand (https://exrx.net/Kinesiology/Segments). 3. Measure your forearm, foot, and hand using a tape measure (or some other device).( forearm= 7inches; foot=10inches; hand=22inches). 4. Indicate the error in %s for each segment (compare measured vs table value), and indicate which if your 3 segments was the furthest off.arrow_forwardMs. Lorraine Finch, a fifth grade teacher has a large class of 50 students for the 2018 - 2019 school year. After giving a reading comprehension test, Ms. Finch decided to do a brief statistical analysis. A frequency distribution of the results is presented below. a. Fill in the missing pa rts of Ms. Finch’s frequency distribution. Do any necessary scrap work in the space next to the table. b. Construct a histogram of the frequency distribution. c Is the distribution of test scores normal? Explain. Score Frequency Relative Frequency 84 2 0.04 85 5 0.1 86 0.08 87 8 0.16 88 10 89 90 5 0.1 91 4 0.08 92 3 0.06arrow_forward
arrow_back_ios
arrow_forward_ios
Recommended textbooks for you
- MATLAB: An Introduction with ApplicationsStatisticsISBN:9781119256830Author:Amos GilatPublisher:John Wiley & Sons Inc
 Probability and Statistics for Engineering and th...StatisticsISBN:9781305251809Author:Jay L. DevorePublisher:Cengage Learning
 Statistics for The Behavioral Sciences (MindTap C...StatisticsISBN:9781305504912Author:Frederick J Gravetter, Larry B. WallnauPublisher:Cengage Learning
  Elementary Statistics: Picturing the World (7th E...StatisticsISBN:9780134683416Author:Ron Larson, Betsy FarberPublisher:PEARSON
 The Basic Practice of StatisticsStatisticsISBN:9781319042578Author:David S. Moore, William I. Notz, Michael A. FlignerPublisher:W. H. Freeman
 Introduction to the Practice of StatisticsStatisticsISBN:9781319013387Author:David S. Moore, George P. McCabe, Bruce A. CraigPublisher:W. H. Freeman
MATLAB: An Introduction with Applications
Statistics
ISBN:9781119256830
Author:Amos Gilat
Publisher:John Wiley & Sons Inc
Probability and Statistics for Engineering and th...
Statistics
ISBN:9781305251809
Author:Jay L. Devore
Publisher:Cengage Learning
Statistics for The Behavioral Sciences (MindTap C...
Statistics
ISBN:9781305504912
Author:Frederick J Gravetter, Larry B. Wallnau
Publisher:Cengage Learning
Elementary Statistics: Picturing the World (7th E...
Statistics
ISBN:9780134683416
Author:Ron Larson, Betsy Farber
Publisher:PEARSON
The Basic Practice of Statistics
Statistics
ISBN:9781319042578
Author:David S. Moore, William I. Notz, Michael A. Fligner
Publisher:W. H. Freeman
Introduction to the Practice of Statistics
Statistics
ISBN:9781319013387
Author:David S. Moore, George P. McCabe, Bruce A. Craig
Publisher:W. H. Freeman