
MATLAB: An Introduction with Applications
6th Edition
ISBN: 9781119256830
Author: Amos Gilat
Publisher: John Wiley & Sons Inc
expand_more
expand_more
format_list_bulleted
Related questions
Question
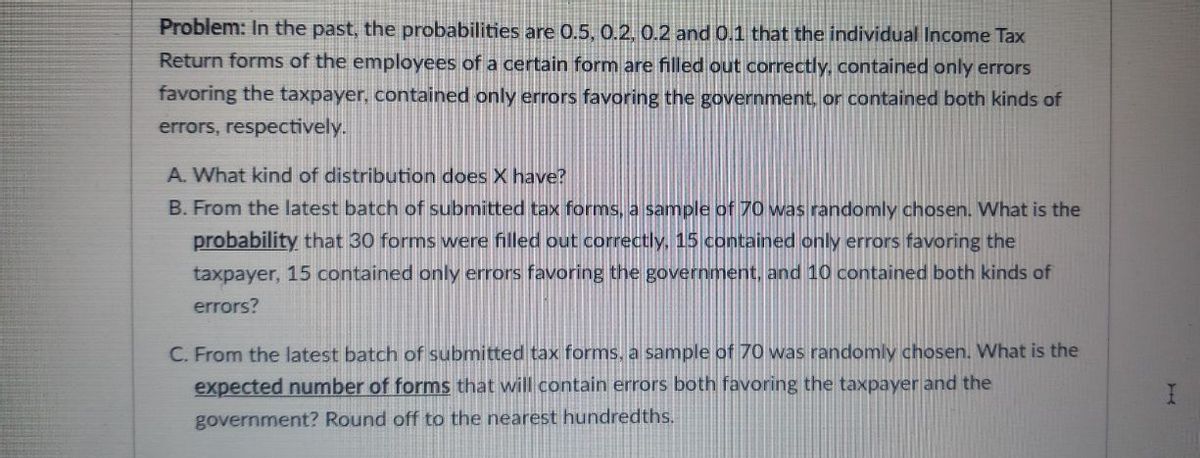

Transcribed Image Text:Problem: In the past, the probabilities are 0.5, 0.2. 0.2 and 0.1 that the individual Income Tax
Return forms of the employees of a certain form are filled out correctly, contained only errors
favoring the taxpayer, contained only errors favoring the government, or contained both kinds of
errors, respectively.
A. What kind of distribution does X have?
B. From the latest batch of submitted tax forms, a sample of 70 was randomly chosen. What is the
probability that 30 forms were filled out correctly, 15 contained only errors favoring the
taxpayer, 15 contained only errors favoring the government, and 10 contained both kinds of
errors?
C. From the latest batch of submitted tax forms, a sample of 70 was randomly chosen. What is the
expected number of forms that will contain errors both favoring the taxpayer and the
government? Round off to the nearest hundredths.
Expert Solution
This question has been solved!
Explore an expertly crafted, step-by-step solution for a thorough understanding of key concepts.

This is a popular solution

Trending nowThis is a popular solution!

Step by stepSolved in 5 steps with 5 images

Knowledge Booster

Similar questions
- 4 children. He makes a fast, wrong estimate of the probability of various mixes of boys and girls among QUESTION 3. Mr. Fastwrong is working for the census department and he is counting families that have the families. His assistant, Ms. Slowright, analyzes the issue and corrects his work. Fill her corrections of his wrong guesses into the table below. Number of boys among the 4 children 1 0 4 3 2 Number of girls among the 4 children 0 1 2 4 Use fractions (not percents) in your answers. Mr. Fastwrong's estimate of the fraction of families having this distribution of boys and girls 1/5 1/5 1/5 1/5 1/5 Ms. Slowright's estimate of the fraction of families having this distribution of boys and girlsarrow_forward21. A survey involving 600 Democrats, 400 Republicans and 200 Independents asked the question: "Do you favor or oppose eliminating taxes on dividends paid to shareholders?" The following results were obtained: Answer Democrats, % Republicans, % Independents, % Favor 29 66 48 Орpose 71 34 52 What is the probability that a person selected at random from this survey answered "favor"?arrow_forward1. The Sports Associates Vending Company supplies refreshments at a baseball stadium and must plan for the possibility of a World Series contest. In the accompanying 4 13 5 22 frequency table (based on past results), x 20 represents the number of baseball games 34 required to complete a World Series contest. a. Construct the corresponding relative frequency table. b. Does the result from part a describe a probability distribution? Why or why not? c. Based on the past results, what is the probability that the next World Series contest will last at least 5 games? d. If two different series included in the table are randomly selected, find the probability that they both lasted 7 games. e. Find the mean number of games for the World Series contests included in the table. f. Find the standard deviation for the number of games for the World Series contests included in the table. g. What is the expected number of games for a World Series contest? If a vendor supplies hot dogs to both stadiums…arrow_forward
- A. 8.51%B. 55%C. 84.08%D. 91.59%arrow_forwardSuppose that 30 percent of an adult population have an infectious disease and 40 percent have achronic disease. Assume that having an infectious disease is independent from having a chronicdisease. For each of the questions below perform the calculation using appropriate statisticalnotation.a. What is the probability that a person selected at random will have both diseases?b. What is the probability of having the infectious disease for people with the chronic disease?c. What is the probability of having the infectious disease for people without the chronic disease?d. What is the probability of not having the infectious disease for people with the chronicdisease?arrow_forward2. Of people who died in the United States in a recent year, 86% were white, 12% were black, and 2% were Asian. (These values ignore a small number of earths among other races. ) Diabetes caused 2.8% of deaths among whites, 4.4% among blacks, and 3.5% among Asians. (a) draw a completely labeled probability tree for this problem. (b) calculate the overall percent of people who died of diabetes across all the three races. (c) given a randomly selected dead person died of diabetes, what is the probability that he/she was white?arrow_forward
- 2. The following table shows the income distribution for two groups of people in a country: those who declare to belong to a faith, and those who declare to be free thinkers. Income bracket Middle 13278 2225 Religious outlook Faith believer Free thinker Lower 7940 1241 Upper 4527 813 (a) A person is randomly selected from the group, find the probability that this person is a (i) free thinker. (ii) free thinker given that he/she has middle income. (iii) faith believer or he/she has lower income. (b) Are the events "Free thinker" and "Middle income" independent? Explain your answer. (Note: Round the probabilities to two significant figures)arrow_forward4. Make a “tree” diagram for the following scenario. You go to the corner of State St. and Center Ave and are looking to see if the drivers of the first three cars that pass by you are wearing hats or not wearing hats. a) Generate the probability distribution for problem number 4 assuming that the probability of a driver wearing a hat is 40% and the random variable x is the number of drivers wearing a hat. b) Find the mean, variance and the standard deviation of the probability distribution in part a. Please show all work.arrow_forwardDetermine the following probabilities using the binomial table.arrow_forward
arrow_back_ios
arrow_forward_ios
Recommended textbooks for you
- MATLAB: An Introduction with ApplicationsStatisticsISBN:9781119256830Author:Amos GilatPublisher:John Wiley & Sons Inc
 Probability and Statistics for Engineering and th...StatisticsISBN:9781305251809Author:Jay L. DevorePublisher:Cengage Learning
 Statistics for The Behavioral Sciences (MindTap C...StatisticsISBN:9781305504912Author:Frederick J Gravetter, Larry B. WallnauPublisher:Cengage Learning
  Elementary Statistics: Picturing the World (7th E...StatisticsISBN:9780134683416Author:Ron Larson, Betsy FarberPublisher:PEARSON
 The Basic Practice of StatisticsStatisticsISBN:9781319042578Author:David S. Moore, William I. Notz, Michael A. FlignerPublisher:W. H. Freeman
 Introduction to the Practice of StatisticsStatisticsISBN:9781319013387Author:David S. Moore, George P. McCabe, Bruce A. CraigPublisher:W. H. Freeman
MATLAB: An Introduction with Applications
Statistics
ISBN:9781119256830
Author:Amos Gilat
Publisher:John Wiley & Sons Inc
Probability and Statistics for Engineering and th...
Statistics
ISBN:9781305251809
Author:Jay L. Devore
Publisher:Cengage Learning
Statistics for The Behavioral Sciences (MindTap C...
Statistics
ISBN:9781305504912
Author:Frederick J Gravetter, Larry B. Wallnau
Publisher:Cengage Learning
Elementary Statistics: Picturing the World (7th E...
Statistics
ISBN:9780134683416
Author:Ron Larson, Betsy Farber
Publisher:PEARSON
The Basic Practice of Statistics
Statistics
ISBN:9781319042578
Author:David S. Moore, William I. Notz, Michael A. Fligner
Publisher:W. H. Freeman
Introduction to the Practice of Statistics
Statistics
ISBN:9781319013387
Author:David S. Moore, George P. McCabe, Bruce A. Craig
Publisher:W. H. Freeman